ICGOO在线商城 > 射频/IF 和 RFID > RF 检测器 > ADL5902ACPZ-R7
 Datasheet下载
- 型号: ADL5902ACPZ-R7
- 制造商: Analog
- 库位|库存: xxxx|xxxx
- 要求:
| 数量阶梯 | 香港交货 | 国内含税 |
| +xxxx | $xxxx | ¥xxxx |
查看当月历史价格
查看今年历史价格
ADL5902ACPZ-R7产品简介:
ICGOO电子元器件商城为您提供ADL5902ACPZ-R7由Analog设计生产,在icgoo商城现货销售,并且可以通过原厂、代理商等渠道进行代购。 ADL5902ACPZ-R7价格参考。AnalogADL5902ACPZ-R7封装/规格:RF 检测器, RF Detector IC CDMA, GSM, TD-SCDMA, W-CDMA, WiMAX 50MHz ~ 9GHz -62dBm ~ 3dBm ±0.3dB 16-VQFN Exposed Pad, CSP。您可以下载ADL5902ACPZ-R7参考资料、Datasheet数据手册功能说明书,资料中有ADL5902ACPZ-R7 详细功能的应用电路图电压和使用方法及教程。
ADL5902ACPZ-R7是Analog Devices Inc.推出的一款高精度RF检波器,广泛应用于需要精确射频功率测量的场景。该器件可在100MHz至10GHz宽频率范围内工作,能够准确检测RF信号的均方根(RMS)功率,适用于无线通信系统中的发射功率控制、功率放大器线性化以及信号强度监测等关键功能。

典型应用场景包括蜂窝基站、微波点对点通信、宽带无线接入系统和测试测量设备。在基站中,ADL5902可用于监控发射通道的输出功率,确保符合标准并防止过载;在有线电视(CATV)基础设施中,可用于维持稳定的信号电平。此外,该器件具备良好的温度稳定性和宽动态范围(可达65 dB),使其在环境变化较大的工业应用中依然保持高可靠性。

ADL5902ACPZ-R7采用紧凑的16引脚LFCSP封装,便于集成到高密度PCB设计中,适合空间受限的应用。其低功耗特性也适用于便携式或远程射频测试设备。总之,该芯片凭借宽频带、高精度和高稳定性,成为现代高性能射频系统中不可或缺的功率检测解决方案。
| 参数 | 数值 |
| 产品目录 | |
| 描述 | IC DETECTOR RF TRUPWR 16LFCSP射频检测器 RMS TruPwr Detectors |
| 产品分类 | |
| 品牌 | Analog Devices Inc |
| 产品手册 | |
| 产品图片 |
|
| rohs | 符合RoHS无铅 / 符合限制有害物质指令(RoHS)规范要求 |
| 产品系列 | RF集成电路,射频检测器,Analog Devices ADL5902ACPZ-R7TruPwr™ |
| 数据手册 | |
| 产品型号 | ADL5902ACPZ-R7 |
| PCN组件/产地 | |
| RF类型 | CDMA,GSM,TD-SCDMA,W-CDMA,WiMAX |
| 产品培训模块 | http://www.digikey.cn/PTM/IndividualPTM.page?site=cn&lang=zhs&ptm=25139 |
| 产品种类 | 射频检测器 |
| 其它名称 | ADL5902ACPZ-R7TR |
| 包装 | 带卷 (TR) |
| 商标 | Analog Devices |
| 安装风格 | SMD/SMT |
| 封装 | Reel |
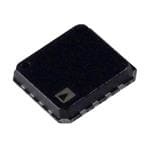
| 封装/外壳 | 16-VQFN 裸露焊盘,CSP |
| 封装/箱体 | LFCSP-16 |
| 工厂包装数量 | 1500 |
| 最大二极管电容 | 100 pF |
| 最大功率耗散 | 550 mW |
| 最大工作温度 | + 125 C |
| 最大正向电压 | 5.5 V |
| 最小工作温度 | - 40 C |
| 标准包装 | 1,500 |
| 电压-电源 | 4.5 V ~ 5.5 V |
| 电流-电源 | 90mA |
| 精度 | ±0.3dB |
| 系列 | ADL5902 |
| 视频文件 | http://www.digikey.cn/classic/video.aspx?PlayerID=1364138032001&width=640&height=505&videoID=2245193150001 |
| 设计资源 | |
| 输入范围 | -62dBm ~ 3dBm |
| 配用 | /product-detail/zh/ADL5902-EVALZ/ADL5902-EVALZ-ND/4866721 |
| 配置 | Single |
| 频率 | 50MHz ~ 9GHz |
| 频率范围 | 50 MHz to 9 GHz |


- 商务部:美国ITC正式对集成电路等产品启动337调查
- 曝三星4nm工艺存在良率问题 高通将骁龙8 Gen1或转产台积电
- 太阳诱电将投资9.5亿元在常州建新厂生产MLCC 预计2023年完工
- 英特尔发布欧洲新工厂建设计划 深化IDM 2.0 战略
- 台积电先进制程称霸业界 有大客户加持明年业绩稳了
- 达到5530亿美元!SIA预计今年全球半导体销售额将创下新高
- 英特尔拟将自动驾驶子公司Mobileye上市 估值或超500亿美元
- 三星加码芯片和SET,合并消费电子和移动部门,撤换高东真等 CEO
- 三星电子宣布重大人事变动 还合并消费电子和移动部门
- 海关总署:前11个月进口集成电路产品价值2.52万亿元 增长14.8%


PDF Datasheet 数据手册内容提取
50 MHz to 9 GHz 65 dB TruPwr Detector Data Sheet ADL5902 FEATURES FUNCTIONAL BLOCK DIAGRAM Accurate rms-to-dc conversion from 50 MHz to 9 GHz VPOS POS 3 10 Single-ended input dynamic range of 65 dB No balun or external input matching required ADL5902 TEMSPEENRSAOTRURE 8 TEMP Waveform and modulation independent, such as 7 VSET GSM/CDMA/W-CDMA/TD-SCDMA/WiMAX/LTE INHI 14 IDET Linear-in-decibels output, scaled 53 mV/dB INLO 15 X2 Transfer function ripple: <±0.1 dB LINEAR-IN-dB VGA (NEGATIVE SLOPE) Temperature stability: <±0.3 dB X2 ITGT All functions temperature and supply stable NC 2 G = 5 6 VOUT Operates from 4.5 V to 5.5 V from −40°C to +125°C Power-down capability to 1.5 mW NC 16 BIAS AND POWER- VREF Pin-compatible with the 50 dB dynamic range AD8363 DOWN CONTROL 2.3V NC 13 5 CLPF APPLICATIONS 26pF PTroawnesrm aimtteprl ipfioewr leinr ecoanritzraotliso n/control loops TADJ/1PWDN VR11EF VT12GT CO9MM CO4MM 08218-001 Figure 1. Transmitter signal strength indication (TSSI) RF instrumentation GENERAL DESCRIPTION The ADL5902 is a true rms responding power detector that has logarithm of the rms value of the input. In other words, the reading a 65 dB measurement range when driven with a single-ended is presented directly in decibels and is scaled 1.06 V per decade, 50 Ω source. This feature makes the ADL5902 frequency or 53 mV/dB; other slopes are easily arranged. In controller mode, versatile by eliminating the need for a balun or any other form the voltage applied to VSET determines the power level required at of external input tuning for operation up to 9 GHz. the input to null the deviation from the set point. The output buffer can provide high load currents. The ADL5902 provides a solution in a variety of high frequency systems requiring an accurate measurement of signal power. The ADL5902 has 1.5 mW power consumption when powered Requiring only a single supply of 5 V and a few capacitors, it is down by a logic high applied to the PWDN pin. It powers up easy to use and capable of being driven single-ended or with a within approximately 5 μs to the nominal operating current of balun for differential input drive. The ADL5902 can operate 73 mA at 25°C. The ADL5902 is supplied in a 4 mm × 4 mm, from 50 MHz to 9 GHz and can accept inputs from −62 dBm to 16-lead LFCSP for operation over the wide temperature range at least +3 dBm with large crest factors, such as GSM, CDMA, of −40°C to +125°C. W-CDMA, TD-SCDMA, WiMAX, and LTE modulated signals. The ADL5902 is also pin-compatible with the AD8363, 50 dB The ADL5902 can determine the true power of a high dynamic range TruPwr™ detector. This feature allows the frequency signal having a complex low frequency modulation designer to create one circuit layout for projects requiring envelope or can be used as a simple low frequency rms different dynamic ranges. A fully populated RoHS-compliant voltmeter. Used as a power measurement device, VOUT is evaluation board is available. connected to VSET. The output is then proportional to the Rev. B Document Feedback Information furnished by Analog Devices is believed to be accurate and reliable. However, no responsibility is assumed by Analog Devices for its use, nor for any infringements of patents or other One Technology Way, P.O. Box 9106, Norwood, MA 02062-9106, U.S.A. rights of third parties that may result from its use. Specifications subject to change without notice. No license is granted by implication or otherwise under any patent or patent rights of Analog Devices. Tel: 781.329.4700 ©2010–2016 Analog Devices, Inc. All rights reserved. Trademarks and registered trademarks are the property of their respective owners. Technical Support www.analog.com
ADL5902 Data Sheet TABLE OF CONTENTS Features .............................................................................................. 1 VSET Interface ............................................................................ 18 Applications ....................................................................................... 1 Output Interface ......................................................................... 18 Functional Block Diagram .............................................................. 1 VTGT Interface .......................................................................... 19 General Description ......................................................................... 1 Basis for Error Calculations ...................................................... 19 Revision History ............................................................................... 2 Measurement Mode Basic Connections.................................. 19 Specifications ..................................................................................... 3 Setting V .................................................................................. 20 TADJ Absolute Maximum Ratings ............................................................ 7 Setting V ................................................................................. 20 TGT ESD Caution .................................................................................. 7 Choosing a Value for C ............................................................ 20 LPF Pin Configuration and Function Descriptions ............................. 8 Output Voltage Scaling .............................................................. 23 Typical Performance Characteristics ............................................. 9 System Calibration and Error Calculation .............................. 24 Theory of Operation ...................................................................... 15 High Frequency Performance ................................................... 25 Square Law Detector and Amplitude Target .............................. 15 Low Frequency Performance .................................................... 25 RF Input Interface ...................................................................... 16 Description of Characterization ............................................... 25 Small Signal Loop Response ..................................................... 17 Evaluation Board Schematics and Artwork ................................ 26 Temperature Sensor Interface ................................................... 17 Assembly Drawings .................................................................... 27 VREF Interface ........................................................................... 17 Outline Dimensions ....................................................................... 28 Temperature Compensation Interface ..................................... 17 Ordering Guide .......................................................................... 28 Power-Down Interface ............................................................... 18 REVISION HISTORY 8/2016—Rev. A to Rev. B Changes to Figure 2 .......................................................................... 8 Updated Outline Dimensions ....................................................... 28 Changes to Ordering Guide .......................................................... 28 7/2011—Rev. 0 to Rev. A Updated Format .................................................................. Universal Changes to Measurement Mode Basic Connections Section and Figure 45 .......................................................................................... 19 Changes to Setting V Section and Choosing a Value for TGT C Section ...................................................................................... 20 LPF Changes to Output Voltage Scaling Section, Figure 49, and Table 7 .............................................................................................. 23 Changes to Figure 54 and Table 8 ................................................. 26 Changes to Figure 55 and Figure 56 ............................................. 27 4/2010—Revision 0: Initial Version Rev. B | Page 2 of 28
Data Sheet ADL5902 SPECIFICATIONS V = 5 V, T = 25°C, Z = 50 Ω, single-ended input drive, R = 60.4 Ω, VOUT connected to VSET, V = 0.8 V, C = 0.1 μF. Negative S A O T TGT LPF current values imply that the ADL5902 is sourcing current out of the indicated pin. Table 1. Parameter Test Conditions/Comments Min Typ Max Unit OVERALL FUNCTION Frequency Range 50 to 9000 MHz RF INPUT INTERFACE Pins INHI, INLO, ac-coupled Input Impedance Single-ended drive, 50 MHz 2000 Ω Common Mode Voltage 2.5 V 100 MHz ±1.0 dB Dynamic Range CW input, T = +25°C, V = 0.5 V 63 dB A TADJ Maximum Input Level, ±1.0 dB Calibration at −60 dBm, −45 dBm, and 0 dBm 3 dBm Minimum Input Level, ±1.0 dB Calibration at −60 dBm, −45 dBm, and 0 dBm −60 dBm Deviation vs. Temperature Deviation from output at 25°C −40°C < T < +85°C; P = 0 dBm −0.11/+0.25 dB A IN −40°C < T < +85°C; P = −45 dBm −0.22/+0.15 dB A IN −40°C < T < +125°C; P = 0 dBm −0.35/+0.25 dB A IN −40°C < T < +125°C; P = −45 dBm −0.22/+0.15 dB A IN Logarithmic Slope −45 dBm < P < 0 dBm; calibration at −45 dBm 53.8 mV/dB IN and 0 dBm Logarithmic Intercept −45 dBm < P < 0 dBm; calibration at −45 dBm −62.1 dBm IN and 0 dBm 700 MHz ±1.0 dB Dynamic Range CW input, T = +25°C,V = 0.4 V 61 dB A TADJ Maximum Input Level, ±1.0 dB Calibration at −60 dBm, −45 dBm, and 0 dBm 1 dBm Minimum Input Level, ±1.0 dB Calibration at −60 dBm, −45 dBm, and 0 dBm −60 dBm Deviation vs. Temperature Deviation from output at 25°C −40°C < T < +85°C; P = 0 dBm +0.3/−0.2 dB A IN −40°C < T < +85°C; P = −45 dBm −0.1/0 dB A IN −40°C < T < +125°C; P = 0 dBm +0.3/−0.4 dB A IN −40°C < T < +125°C; P = −45 dBm −0.1/0 dB A IN Logarithmic Slope −45 dBm < P < 0 dBm; calibration at −45 dBm 53.7 mV/dB IN and 0 dBm Logarithmic Intercept −45 dBm < P < 0 dBm; calibration at −45 dBm −62.8 dBm IN and 0 dBm 900 MHz ±1.0 dB Dynamic Range CW input, T = +25°C, V = 0.4 V 61 dB A TADJ Maximum Input Level, ±1.0 dB Calibration at −60 dBm, −45 dBm, and 0 dBm 1 dBm Minimum Input Level, ±1.0 dB Calibration at −60 dBm, −45 dBm, and 0 dBm −60 dBm Deviation vs. Temperature Deviation from output at 25°C −40°C < T < +85°C; P = 0 dBm +0.3/−0.2 dB A IN −40°C < T < +85°C; P = −45 dBm 0/−0.1 dB A IN −40°C < T < +125°C; P = 0 dBm +0.3/−0.4 dB A IN −40°C < T < +125°C; P = −45 dBm 0/−0.1 dB A IN Logarithmic Slope −45 dBm < P < 0 dBm; calibration at −45 dBm 53.7 mV/dB IN and 0 dBm Logarithmic Intercept −45 dBm < P < 0 dBm; calibration at −45 dBm −62.7 dBm IN and 0 dBm Rev. B | Page 3 of 28
ADL5902 Data Sheet Parameter Test Conditions/Comments Min Typ Max Unit Deviation from CW Response 11.02 dB peak-to-rms ratio (CDMA2000) −0.1 dB 5.13 dB peak-to-rms ratio (16 QAM) −0.05 dB 2.76 dB peak-to-rms ratio (QPSK) −0.05 dB 1.9 GHz ±1.0 dB Dynamic Range CW input, T = +25°C, V = 0.4 V 64 dB A TADJ Maximum Input Level, ±1.0 dB Calibration at −60 dBm, −45 dBm, and 0 dBm 3 dBm Minimum Input Level, ±1.0 dB Calibration at −60 dBm, −45 dBm, and 0 dBm −61 dBm Deviation vs. Temperature Deviation from output at 25°C −40°C < T < +85°C; P = 0 dBm −0.1/0 dB A IN −40°C < T < +85°C; P = −45 dBm −0.3/+0.3 dB A IN −40°C < T < +125°C; P = 0 dBm −0.1/0 dB A IN −40°C < T < +125°C; P = −45 dBm −0.3/+0.4 dB A IN Logarithmic Slope −45 dBm < P < 0 dBm; calibration at −45 dBm, 52.6 mV/dB IN and 0 dBm Logarithmic Intercept −45 dBm < P < 0 dBm; calibration at −45 dBm −62.6 dBm IN and 0 dBm 2.14 GHz ±1.0 dB Dynamic Range CW input, T = +25°C, V = 0.4 V 65 dB A TADJ Maximum Input Level, ±1.0 dB Calibration at −60 dBm, −45 dBm, and 0 dBm 3 dBm Minimum Input Level, ±1.0 dB Calibration at −60 dBm, −45 dBm, and 0 dBm −62 dBm Deviation vs. Temperature Deviation from output at 25°C −40°C < T < +85°C; P = 0 dBm −0.1/0 dB A IN −40°C < T < +85°C; P = −45 dBm −0.3/+0.3 dB A IN −40°C < T < +125°C; P = 0 dBm −0.1/0 dB A IN −40°C < T < +125°C; P = −45 dBm −0.3/+0.4 dB A IN Logarithmic Slope −45 dBm < P < 0 dBm; calibration at −45 dBm 52.4 mV/dB IN and 0 dBm Logarithmic Intercept −45 dBm < P < 0 dBm; calibration at −45 dBm −62.9 dBm IN and 0 dBm Deviation from CW Response 12.16 dB peak-to-rms ratio (four-carrier W-CDMA) −0.1 dB 11.58 dB peak-to-rms ratio (LTE TM1 1CR 20 MHz BW) −0.1 dB 10.56 dB peak-to-rms ratio (one-carrier W-CDMA) −0.1 dB 6.2 dB peak-to-rms ratio (64 QAM) −0.07 dB 2.6 GHz ±1.0 dB Dynamic Range CW input, T = +25°C, V = 0.45 V 65 dB A TADJ Maximum Input Level, ±1.0 dB Calibration at −60, −45 and 0 dBm 5 dBm Minimum Input Level, ±1.0 dB Calibration at −60, −45 and 0 dBm −60 dBm Deviation vs. Temperature Deviation from output at 25°C −40°C < T < +85°C; P = 0 dBm 0.4/0 dB A IN −40°C < T < +85°C; P = −45 dBm +0.5/−0.6 dB A IN −40°C < T < +125°C; P = 0 dBm 0.6/0 dB A IN −40°C < T < +125°C; P = −45 dBm +0.7/−0.6 dB A IN Logarithmic Slope −45 dBm < P < 0 dBm; calibration at −45 dBm 51.0 mV/dB IN and 0 dBm Logarithmic Intercept −45 dBm < P < 0 dBm; calibration at −45 dBm −62.1 dBm IN and 0 dBm 3.5 GHz ±1.0 dB Dynamic Range CW input, T = +25°C, V = 0.5 V 57 dB A TADJ Maximum Input Level, ±1.0 dB Calibration at −60 dBm, −40 dBm, and 0 dBm 8 dBm Minimum Input Level, ±1.0 dB Calibration at −60 dBm, −40 dBm, and 0 dBm −49 dBm Rev. B | Page 4 of 28
Data Sheet ADL5902 Parameter Test Conditions/Comments Min Typ Max Unit Deviation vs. Temperature Deviation from output at 25°C −40°C < T < +85°C; P = 0 dBm 0.2/0 dB A IN −40°C < T < +85°C; P = −40 dBm −0.2/+0.4 dB A IN −40°C < T < +125°C; P = 0 dBm +0.2/−0.3 dB A IN −40°C < T < +125°C; P = −40 dBm −0.2/+0.4 dB A IN Logarithmic Slope −40 dBm < P < 0 dBm; calibration at −30 dBm 49.6 mV/dB IN and 0 dBm Logarithmic Intercept −40 dBm < P < 0 dBm; calibration at −30 dBm −63.1 dBm IN and 0 dBm 5.8 GHz ±1.0 dB Dynamic Range CW input, T = +25°C, V = 0.95 V 61 dB A TADJ Maximum Input Level, ±1.0 dB Calibration at −50 dBm, −30 dBm, and 0 dBm 9 dBm Minimum Input Level, ±1.0 dB Calibration at −50 dBm, −30 dBm, and 0 dBm −52 dBm Deviation vs. Temperature Deviation from output at 25°C −40°C < T < +85°C; P = 0 dBm −0.8/0 dB A IN −40°C < T < +85°C; P = −30 dBm −1.3/+0.1 dB A IN −40°C < T < +125°C; P = 0 dBm −1.6/0 dB A IN −40°C < T < +125°C; P = −30 dBm −1.3/+0.1 dB A IN Logarithmic Slope −30 dBm < P < 0 dBm; calibration at −30 dBm 42.7 mV/dB IN and 0 dBm Logarithmic Intercept −30 dBm < P < 0 dBm; calibration at −30 dBm −54.1 dBm IN and 0 dBm OUTPUT INTERFACE VOUT (Pin 6) Output Swing, Controller Mode Swing range minimum, R ≥ 500 Ω to ground 0.03 V L Swing range maximum, R ≥ 500 Ω to ground 4.8 V L Current Source/Sink Capability 10/10 mA Voltage Regulation I = 8 mA, source/sink +0.2/−0.2 % LOAD Output Noise RF = 2.14 GHz, −20 dBm, f = 100 kHz, 25 nV/√Hz IN NOISE C = 220 pF LPF Rise Time Transition from no input to 1 dB settling at 3 μs P = −10 dBm, C = 220 pF IN LPF Fall Time Transition from −10 dBm to off (1 dB of final value), 25 μs C = 220 pF LPF SETPOINT INPUT VSET (Pin 7) Voltage Range Log conformance error ≤ 1 dB, minimum 2.14 GHz 3.5 V Log conformance error ≤ 1 dB, maximum 2.14 GHz 0.23 V Input Resistance 72 kΩ Logarithmic Scale Factor f = 2.14 GHz 52.4 mV/dB Logarithmic Intercept f = 2.14 GHz −62.9 dBm TEMPERATURE COMPENSATION Pin TADJ/PWDN (Pin 1) Input Voltage Range 0 V V S Input Bias Current V = 0.4 V 2 μA TADJ Input Resistance V = 0.4 V 200 kΩ TADJ VOLTAGE REFERENCE VREF (Pin 11) Output Voltage P = −55 dBm 2.3 V IN Temperature Sensitivity 25°C ≤ T ≤ 125°C −0.16 mV/°C A −15°C ≤ T ≤ +25°C 0.045 mV/°C A −40°C ≤ T ≤ −15°C −0.04 mV/°C A Short-Circuit Current Source/ Sink 25°C ≤ T ≤ 125°C 4/0.05 mA A Capability −40°C ≤ T < +25°C 3/0.05 mA A Voltage Regulation T = 25°C, I = 2 mA −0.4 % A LOAD Rev. B | Page 5 of 28
ADL5902 Data Sheet Parameter Test Conditions/Comments Min Typ Max Unit TEMPERATURE REFERENCE TEMP (Pin 8) Output Voltage T = 25°C, R ≥ 10 kΩ 1.4 V A L Temperature Coefficient −40°C ≤ T ≤ +125°C, R ≥ 10 kΩ 4.9 mV/°C A L Short-Circuit Current Source/ Sink 25°C ≤ T ≤ 125°C 4/0.05 mA A Capability −40°C ≤ T < +25°C 3/0.05 mA A Voltage Regulation T = 25°C, I = 1 mA −2.8 % A LOAD RMS TARGET INTERFACE VTGT (Pin 12) Input Voltage Range 0.2 2.5 V Input Bias Current V = 0.8 V 8 μA TGT Input Resistance 100 kΩ POWER-DOWN INTERFACE Pin TADJ/PWDN (Pin 1) Voltage Level to Enable V decreasing 4 V PWDN Voltage Level to Disable V increasing 4.9 V PWDN Input Current V = 5 V 1 μA PWDN V = 4.5 V 500 μA PWDN V = 0 V 3 μA PWDN Enable Time V low to V at 1 dB of final value, 5 μs TADJ OUT C = 220 pF, P = 0 dBm LPA/B IN Disable Time V high to V at 1 dB of final value, 3 μs TADJ OUT C = 220 pF, P = 0 dBm LPA/B IN POWER SUPPLY INTERFACE VPOS (Pin 3, Pin 10) Supply Voltage 4.5 5 5.5 V Quiescent Current T = 25°C, P < −60 dBm 73 mA A IN T = 125°C, P < −60 dBm 90 mA A IN Power-Down Current V > V − 0.1 V 300 μA TADJ S Rev. B | Page 6 of 28
Data Sheet ADL5902 ABSOLUTE MAXIMUM RATINGS Stresses at or above those listed under Absolute Maximum Table 2. Ratings may cause permanent damage to the product. This is a Parameter Rating stress rating only; functional operation of the product at these Supply Voltage, VPOS 5.5 V or any other conditions above those indicated in the operational Input Average RF Power1 21 dBm section of this specification is not implied. Operation beyond Equivalent Voltage, Sine Wave Input 2.51 V p-p the maximum operating conditions for extended periods may Internal Power Dissipation 550 mW affect product reliability. θ 2 10.6°C/W JC θ 2 35.3°C/W ESD CAUTION JB θ 2 57.2°C/W JA Ψ 2 1.0°C/W JT Ψ 2 34°C/W JB Maximum Junction Temperature 150°C Operating Temperature Range −40°C to +125°C Storage Temperature Range −65°C to +150°C Lead Temperature (Soldering, 60 sec) 300°C 1 This is for long durations. Excursions above this level, with durations much less than 1 second, are possible without damage. 2 No airflow with the exposed pad soldered to a 4-layer JEDEC board. Rev. B | Page 7 of 28
ADL5902 Data Sheet PIN CONFIGURATION AND FUNCTION DESCRIPTIONS PIN 1 NC INLO INHI NC INDICATOR 16 15 14 13 TADJ/PWDN 1 12 VTGT NC 2 ADL5902 11 VREF VPOS 3 TOP VIEW 10 VPOS (Not to Scale) COMM 4 9 COMM 5 6 7 8 F T T P P U E M CL VO VS TE NOTES 1. NC = NO CONNECT. 2 . THEHALVEEEC E TBXRPOIOCTAHSLE A DC GOPOANODND EIS CT TCHIOEORMNMMTAOAL NGADRN SODH UGONOUDOL.DD 08218-002 Figure 2. Pin Configuration Table 3. Pin Function Descriptions Pin No. Mnemonic Description 1 TADJ/PWDN This is a dual function pin used for controlling the amount of nonlinear intercept temperature compensation at voltages <2.5 V and/or for shutting down the device at voltages >4 V. If the shutdown function is not used, this pin can be connected to the VREF pin through a voltage divider. See Figure 41 for an equivalent circuit. 2 NC No Connect. Do not connect this pin. 3, 10 VPOS Supply for the Device. Connect this pin to a 5 V power supply. Pin 3 and Pin 10 are not internally connected; therefore, both must connect to the source. 4, 9, EPAD COMM System Common Connection. Connect these pins via low impedance to system common. The exposed paddle is also COMM and must have both a good thermal and good electrical connection to ground. 5 CLPF Connection for RMS Averaging Capacitor. Connect a ground-referenced capacitor to this pin. A resistor can be connected in series with this capacitor to modify loop stability and response time. See Figure 43 for an equivalent circuit. 6 VOUT Output. In measurement mode, this pin is connected to VSET. In controller mode, this pin can drive a gain control element. See Figure 43 for an equivalent circuit. 7 VSET The voltage applied to this pin sets the decibel value of the required RF input voltage that results in zero current flow in the loop integrating capacitor pin, CLPF. This pin controls the variable gain amplifier (VGA) gain such that a 50 mV change in V changes the gain by approximately 1 dB. See Figure 42 for an equivalent circuit. SET 8 TEMP Temperature Sensor Output of 1.4 V at 25°C with a Coefficient of 5 mV/°C. See Figure 38 for an equivalent circuit. 11 VREF General-Purpose Reference Voltage Output of 2.3 V at 25°C. See Figure 39 for an equivalent circuit. 12 VTGT The voltage applied to this pin determines the target power at the input of the RF squaring circuit. The intercept voltage is proportional to the voltage applied to this pin. The use of a lower target voltage increases the crest factor capacity; however, this can affect the system loop response. See Figure 44 for an equivalent circuit. 13 NC No Connect. Do not connect this pin. 14 INHI RF Input. The RF input signal is normally ac-coupled to this pin through a coupling capacitor. See Figure 37 for an equivalent circuit. 15 INLO RF Input Common. This pin is normally ac-coupled to ground through a coupling capacitor. See Figure 37 for an equivalent circuit. 16 NC No Connect. Do not connect this pin. Rev. B | Page 8 of 28
Data Sheet ADL5902 TYPICAL PERFORMANCE CHARACTERISTICS V = 5 V, Z = 50 Ω, single-ended input drive, VOUT connected to VSET, V = 0.8 V, C = 0.1 μF, T = +25°C (black), −40°C (blue), S O TGT LPF A +85°C (red), +125°C (orange) where appropriate. Error referred to the best fit line (linear regression) from − 10 dBm to − 40 dBm, unless otherwise indicated. Input RF signal is a sine wave (CW), unless otherwise indicated. 6.0 6 6.0 6 TADJ = 0.5V VTADJ = 0.5V 5.5 CALIBRATION AT 0dBm, –45dBm, AND –60dBm 5 5.5 REPRESENTS 55 DEVICES FROM 2 LOTS 5 5.0 4 5.0 4 4.5 3 4.5 3 E (V) 4.0 2 E (V) 4.0 2 PUT VOLTAG 233...505 –011 ERROR (dB) TAGPUT VOL 233...505 01–1 ERROR (dB) UT 2.0 –2 UT 2.0 –2 O O 1.5 –3 1.5 –3 1.0 –4 1.0 –4 0.5 –5 0.5 –5 0 –6 0 –6 –60 –50 –40 –3P0IN (dBm–2)0 –10 0 10 08218-003 –60 –50 –40 –3P0IN (dBm–2)0 –10 0 10 08218-006 Figure 3. Typical VOUT and Log Conformance Error with Respect to 25°C Ideal Figure 6. Distribution of Error with Respect to 25°C over Temperature vs. Line over Temperature vs. Input Amplitude at 100 MHz, CW Input Amplitude, CW, Frequency = 100 MHz 6.0 6 6.0 6 TADJ = 0.4V VTADJ = 0.4V 5.5 CALIBRATION AT 0dBm, –45dBm, AND –60dBm 5 5.5 REPRESENTS 55 DEVICES FROM 2 LOTS 5 5.0 4 5.0 4 4.5 3 4.5 3 V) V) E ( 4.0 2 E ( 4.0 2 VOLTAG 33..05 01 OR (dB) VOLTAG 33..05 01 OR (dB) PUT 2.5 –1 ERR PUT 2.5 –1 ERR UT 2.0 –2 UT 2.0 –2 O O 1.5 –3 1.5 –3 1.0 –4 1.0 –4 0.5 –5 0.5 –5 0 –6 0 –6 –60 –50 –40 –3P0IN (dBm–2)0 –10 0 10 08218-004 –60 –50 –40 –3P0IN (dBm–2)0 –10 0 10 08218-007 Figure 4. Typical VOUT and Log Conformance Error with Respect to 25°C Ideal Figure 7. Distribution of Error with Respect to 25°C over Temperature vs. Line over Temperature vs. Input Amplitude at 700 MHz, CW Input Amplitude, CW, Frequency = 700 MHz 6.0 6 6.0 6 5.5 CTAADLJI B=R 0A.4TVION AT 0dBm, –45dBm, AND –60dBm 5 5.5 VRTEAPDRJE =S 0E.N4VTS 55 DEVICES FROM 2 LOTS 5 5.0 4 5.0 4 4.5 3 4.5 3 E (V) 4.0 2 E (V) 4.0 2 PUT VOLTAG 233...505 –011 ERROR (dB) PUT VOLTAG 233...505 –011 ERROR (dB) UT 2.0 –2 UT 2.0 –2 O O 1.5 –3 1.5 –3 1.0 –4 1.0 –4 0.5 –5 0.5 –5 0–60 –50 –40 –3P0IN (dBm–2)0 –10 0 10–6 08218-005 0–60 –50 –40 –3P0IN (dBm–2)0 –10 0 10–6 08218-008 Figure 5. Typical VOUT and Log Conformance Error with Respect to 25°C Ideal Figure 8. Distribution of Error with Respect to 25°C over Temperature vs. Line over Temperature vs. Input Amplitude at 900 MHz, CW Input Amplitude, CW, Frequency = 900 MHz Rev. B | Page 9 of 28
ADL5902 Data Sheet 6.0 6 6.0 6 5.5 CTAADLJI B=R 0A.4TVION AT 0dBm, –45dBm, AND –60dBm 5 5.5 RVTEAPDRJE =S 0E.N4VTS 55 DEVICES FROM 2 LOTS 5 5.0 4 5.0 4 4.5 3 4.5 3 OUTPUT VOLTAGE (V) 22334.....05050 ––01221 ERROR (dB) OUTPUT VOLTAGE (V) 22334.....05050 ––01221 ERROR (dB) 1.5 –3 1.5 –3 1.0 –4 1.0 –4 0.5 –5 0.5 –5 0 –6 0 –6 –60 –50 –40 –3P0IN (dBm–2)0 –10 0 10 08218-009 –60 –50 –40 –3P0IN (dBm–2)0 –10 0 10 08218-012 Figure 9. Typical VOUT and Log Conformance Error with Respect to 25°C Ideal Figure 12. Distribution of Error with Respect to 25°C over Temperature vs. Line over Temperature vs. Input Amplitude at 1.9 GHz, CW Input Amplitude, CW, Frequency = 1.9 GHz 6.0 6 6.0 6 5.5 CTAADLJI B=R 0A.4TVION AT 0dBm, –45dBm, AND –60dBm 5 5.5 RVTEAPDRJE =S 0E.N4VTS 55 DEVICES FROM 2 LOTS 5 5.0 4 5.0 4 4.5 3 4.5 3 OUTPUT VOLTAGE (V) 122334......505050 –––012321 ERROR (dB) OUTPUT VOLTAGE (V) 122334......505050 –––012321 ERROR (dB) 1.0 –4 1.0 –4 0.5 –5 0.5 –5 0 –6 0 –6 –60 –50 –40 –3P0IN (dBm–2)0 –10 0 10 08218-010 –60 –50 –40 –3P0IN (dBm–2)0 –10 0 10 08218-013 Figure 10. Typical VOUT and Log Conformance Error with Respect to 25°C Ideal Figure 13. Distribution of Error with Respect to 25°C over Temperature vs. Line over Temperature vs. Input Amplitude at 2.14 GHz, CW Input Amplitude, CW, Frequency = 2.14 GHz 6.0 6 6.0 6 5.5 CTAADLJI B=R 0A.4T5IVON AT 0dBm, –45dBm, AND –60dBm 5 5.5 VRTEAPDRJE =S 0E.N45TVS 55 DEVICES FROM 2 LOTS 5 5.0 4 5.0 4 4.5 3 4.5 3 OUTPUT VOLTAGE (V) 22334.....05050 ––01221 ERROR (dB) OUTPUT VOLTAGE (V) 22334.....05050 ––01221 ERROR (dB) 1.5 –3 1.5 –3 1.0 –4 1.0 –4 0.5 –5 0.5 –5 0 –6 0 –6 –60 –50 –40 –3P0IN (dBm–2)0 –10 0 10 08218-011 –60 –50 –40 –3P0IN (dBm–2)0 –10 0 10 08218-014 Figure 11. Typical VOUT and Log Conformance Error with Respect to 25°C Ideal Figure 14. Distribution of Error with Respect to 25°C over Temperature vs. Line over Temperature vs. Input Amplitude at 2.6 GHz, CW Input Amplitude, CW, Frequency = 2.6 GHz Rev. B | Page 10 of 28
Data Sheet ADL5902 6.0 6 6.0 6 TADJ = 0.5V VTADJ = 0.5V 5.5 CALIBRATION AT 0dBm, –40dBm, AND –60dBm 5 5.5 REPRESENTS 55 DEVICES FROM 2 LOTS 5 5.0 4 5.0 4 4.5 3 4.5 3 V) V) E ( 4.0 2 E ( 4.0 2 OLTAG 33..05 01 R (dB) OLTAG 33..05 01 R (dB) V O V O PUT 2.5 –1 ERR PUT 2.5 –1 ERR UT 2.0 –2 UT 2.0 –2 O O 1.5 –3 1.5 –3 1.0 –4 1.0 –4 0.5 –5 0.5 –5 0 –6 0 –6 –60 –50 –40 –3P0IN (dBm–2)0 –10 0 10 08218-115 –60 –50 –40 –3P0IN (dBm–2)0 –10 0 10 08218-018 Figure 15. Typical VOUT and Log Conformance Error with Respect to 25°C Ideal Figure 18. Distribution of Error with Respect to 25°C over Temperature vs. Line over Temperature vs. Input Amplitude at 3.5 GHz, CW Input Amplitude, CW, Frequency = 3.5 GHz 3.0 6 3.0 6 CTAADLJI B=R 0A.9T5IVON AT 0dBm, –30dBm, AND –50dBm 5 RVTEAPDRJE =S 0E.N95TVS 55 DEVICES FROM 2 LOTS 5 2.5 4 2.5 4 3 3 V) V) E ( 2.0 2 E ( 2.0 2 PUT VOLTAG 1.5 –011 ERROR (dB) PUT VOLTAG 1.5 –011 ERROR (dB) UT 1.0 –2 UT 1.0 –2 O O –3 –3 0.5 –4 0.5 –4 –5 –5 0 –6 0 –6 –60 –50 –40 –3P0IN (dBm–2)0 –10 0 10 08218-016 –60 –50 –40 –3P0IN (dBm–2)0 –10 0 10 08218-019 Figure 16. Typical VOUT and Log Conformance Error with Respect to 25°C Ideal Figure 19. Distribution of Error with Respect to 25°C over Temperature vs. Line over Temperature vs. Input Amplitude at 5.8 GHz, CW Input Amplitude, CW, Frequency = 5.8 GHz REPRESENTS 1900 350 350 REPRESENTS 1900 PARTS FROM 3 LOTS PARTS FROM 3 LOTS 300 300 250 250 NT 200 T 200 U N O U C O 150 C 150 100 100 50 50 02.65 2.70 2.75 2.80VOU2.T8 (5V) 2.90 2.95 3.00 3.05 08218-017 00.20 0.25 0.30 VOU0.T3 (5V) 0.40 0.45 0.50 08218-020 Figure 17. Distribution of VOUT, PIN = −10 dBm, 900 MHz Figure 20. Distribution of VOUT, PIN = −60 dBm, 900 MHz Rev. B | Page 11 of 28
ADL5902 Data Sheet 6.0 6 6.0 6 VOUT CW PEP = 0dB VOUT CW PEP = 0dB 5.5 VOUT QPSK PEP = 2.76 5 5.5 VOUT 64 QAM PEP = 6.2dB 5 VOUT 16 QAM PEP = 5.13 VOUT 1CR W-CDMA PEP = 10.56dB 5.0 VOUT CDMA2000 PEP = 11.02 4 5.0 VOUT 4CR W-CDMA 4 ERROR CW VOUT LTE TM1 1CR 20MHz PEP = 11.58dB 4.5 ERROR QPSK 3 4.5 ERROR CW 3 V) ERROR 16 QAM V) ERROR 64 QAM OLTAGE ( 334...050 ERROR CDMA2000 012 R (dB) OLTAGE ( 334...050 EEERRRRRROOORRR L14CCTERR TWWM--CC1 DD1MMCRAA 20MHz 012 R (dB) V O V O PUT 2.5 –1 ERR PUT 2.5 –1 ERR UT 2.0 –2 UT 2.0 –2 O O 1.5 –3 1.5 –3 1.0 –4 1.0 –4 0.5 –5 0.5 –5 0–60 –50 –40 –3P0IN (dBm–2)0 –10 0 10–6 08218-121 0–60 –50 –40 –3P0IN (dBm–2)0 –10 0 10–6 08218-124 Figure 21. Error from CW Linear Reference vs. Signal Modulation, Figure 24. Error from CW Linear Reference vs. Signal Modulation, Frequency = 900 MHz, CLPF = 0.1μF, Three-Point Calibration at 0 dBm, Frequency = 2.14 GHz, CLPF = 0.1 μF, Three-Point Calibration at −10 dBm, −45 dBm, and −60 dBm −45 dBm, and −60 dBm 6 6 RF ENVELOPE –20dBm RF ENVELOPE –20dBm 0dBm –30dBm 0dBm –30dBm –10dBm –40dBm –10dBm –40dBm 5 5 E (V) 4 E (V) 4 G G A A T T L L O 3 O 3 V V T T U U P P UT 2 UT 2 O O 1 1 0 0 –1 0 1 2 3TIME4 (µs) 5 6 7 8 9 08218-027 –4 0 4 8 12TIM1E6 (µs)20 24 28 32 36 08218-030 Figure 22. Output Response to RF Burst Input, Carrier Frequency 2.14 GHz, Figure 25. Output Response to RF Burst Input, Carrier Frequency 2.14 GHz, CLPF = 220 pF, Rising Edge CLPF = 220 pF, Falling Edge 6 6 RF ENVELOPE –20dBm RF ENVELOPE –20dBm 0dBm –30dBm 0dBm –30dBm –10dBm –40dBm –10dBm –40dBm 5 5 E (V) 4 E (V) 4 G G A A LT LT O 3 O 3 V V T T U U P P UT 2 UT 2 O O 1 1 0 0 –200 0 200 400 600TIM8E0 0(µs1)000 1200 1400 1600 1800 08218-028 –2000 0 2000 4000 6000TIM8E00 (0µs1)0,00012,00014,00016,00018,000 08218-031 Figure 23. Output Response to RF Burst Input, Carrier Frequency 2.14 GHz, Figure 26. Output Response to RF Burst Input, Carrier Frequency 2.14 GHz, CLPF = 0.1 μF, Rising Edge CLPF = 0.1 μF, Falling Edge Rev. B | Page 12 of 28
Data Sheet ADL5902 REPRESENTS 1900 2.5 2.5 PARTS FROM 3 LOTS 2.3 2.0 400 2.1 1.5 1.9 1.0 300 OUNT (V)MP 11..57 00.5 OR (°C) C 200 VTE 1.3 –0.5 ERR 1.1 –1.0 100 0.9 –1.5 0.7 –2.0 0 1.29 1.32 1.35VTEMP1 .3V8OLTA1.G41E (V)1.44 1.47 1.50 08218-033 0.5–55 –35 –15 5TEM2P5ERAT4U5RE (°6C5) 85 105 125 –2.5 08218-036 Figure 27. Distribution of VTEMP Voltage at 25°C, No RF Input Figure 30. VTEMP and Linearity Error with Respect to Straight Line vs. Temperature for Typical Device 0.2 REPRESENTS 1900 PARTS FROM 3 LOTS 400 0 V) m –0.2 OUNT 300 N V (REF–0.4 C 200 E I G N HA –0.6 C 100 –0.8 0 –1.0 2.19 2.22 2.25VRE2F.2 B8IAS 2V.O31LTAG2.E3 4(V) 2.37 2.40 2.43 08218-034 –50 –40 –30 –2P0IN (dBm–1)0 0 10 20 08218-035 Figure 28. Distribution of VREF Voltage at 25°C, No RF Input Figure 31. Change in VREF vs. Input Amplitude with Respect to −40 dBm, 25°C, Typical Device 40 100 30 20 mV) A) V (REF 10 NT (m 10 N 0 RE CHANGE I –10 PPLY CUR 1 DECVRPEWADSNING –20 U S VPWDN –30 INCREASING –40 –55 –35 –15 5TEM2P5ERAT4U5RE (°6C5) 85 105 125 08218-037 0.14.0 4.1 4.2 4.3 4.4VPW4D.5N (V)4.6 4.7 4.8 4.9 5.0 08218-038 Figure 29. Change in VREF vs. Temperature with Respect to 25°C, Figure 32. Supply Current vs. VPWDN RF Input = −40 dBm, Typical Device Rev. B | Page 13 of 28
ADL5902 Data Sheet 7 200 180 6 TADJ/PWDN PULSE √Hz) 160 V/ GE (V) 5 SITY (n 112400 A 4 N T E T VOL 3 0dBm RAL D 100 PU –10dBm CT 80 OUT 2 –20dBm SPE 60 –30dBm E –40dBm OIS 40 1 N 20 0 0 –4 0 4 8 T12IME (µ1s6) 20 24 28 32 08218-032 100 1k F1R0EkQUENCY1 (0H0zk) 1M 10M 08218-039 Figure 33. Output Response Using Power-Down Mode for Various RF Input Figure 35. Noise Spectral Density of VOUT, RF Input = −20 dBm, All CLPF Values Levels Carrier Frequency 2.14 GHz, CLPF = 220 pF 3.5 3.0 2.5 –10dBm V) 2.0 (UT VO 1.5 –30dBm 1.0 0.5 0 0 1 2 3FREQ4UENCY5 (GHz6) 7 8 9 08218-026 Figure 34. Typical VOUT vs. Frequency for Two RF Input Amplitudes, 50 MHz to 9 GHz Rev. B | Page 14 of 28
Data Sheet ADL5902 THEORY OF OPERATION The ADL5902 is a 50 MHz to 9 GHz true rms responding The VGA output is detector with a 65 dB measurement range at 2.14 GHz and a VSIG = GSET × RFIN = GO × RFIN e (VSET/VGNS) (2) greater than 56 dB measurement range at frequencies up to 6 GHz. It incorporates a modified AD8362 architecture that increases the where RFIN is the ac voltage applied to the input terminals of the frequency range and improves measurement accuracy at high ADL5902. frequencies. Transfer function peak-to-peak ripple is reduced to The output of the VGA, V , is applied to a wideband square SIG <±0.1 dB over the entire dynamic range. Temperature stability of law detector. The detector provides the true rms response of the the rms output measurements provides <±0.3 dB error, typically, RF input signal, independent of waveform. The detector output, over the specified temperature range of −40°C to 125°C through I , is a fluctuating current with positive mean value. The SQR proprietary techniques. The device accurately measures waveforms difference between I and an internally generated current, I , is SQR TGT that have a high peak-to-rms ratio (crest factor). integrated by the parallel combination of C and the external F The ADL5902 consists of a high performance AGC loop. As capacitor attached to the CLPF pin at the summing node. CF is shown in Figure 36, the AGC loop comprises a wide bandwidth an on-chip 26 pF filter capacitor, and CLPF, the external capacitance variable gain amplifier (VGA), square law detectors, an amplitude connected to the CLPF pin, can arbitrarily increase the averaging target circuit, and an output driver. For a more detailed description time while trading off with the response time. When the AGC of the functional blocks, see the AD8362 data sheet. loop is at equilibrium The nomenclature used in this data sheet to distinguish Mean(ISQR) = ITGT (3) between a pin name and the signal on that pin is as follows: This equilibrium occurs only when The pin name is all uppercase, for example, VPOS, Mean(V 2) = V 2 (4) SIG TGT COMM, and VOUT. where V is the voltage presented at the VTGT pin. This pin TGT The signal name or a value associated with that pin is the can conveniently be connected to the VREF pin through a voltage pin mnemonic with a partial subscript, for example, C LPF divider to establish a target rms voltage, V , of ~40 mV rms when ATG and V . OUT V = 0.8 V. TGT SQUARE LAW DETECTOR AND AMPLITUDE TARGET Because the square law detectors are electrically identical and The VGA gain has the form well matched, process and temperature dependent variations are effectively cancelled. GSET = GO e (VSET/VGNS) (1) where: G is the basic fixed gain. O V is a scaling voltage that defines the gain slope (the decibel GNS change per voltage). The gain decreases with increasing V . SET VPOS CH (INTERNAL) SUMMING VTGT NODE VATG = 20 INHI VSIG ISQR ITGT VGA X2 X2 VTGT INLO GSET CLPF VSET CLPF CF VOUT (EXTERNAL) (INTERNAL) COMM TEMPERATURE COMPENSATION AND BIAS TADJ/PWDN TEMPERATURE SENSOR TEMP (1.4V) RBEAFNEDR EGNACPE VREF (2.3V) 08218-040 Figure 36. Simplified Architecture Details Rev. B | Page 15 of 28
ADL5902 Data Sheet When forcing the previous identity by varying the VGA setpoint, it RF INPUT INTERFACE is apparent that Figure 37 shows the RF input connections within the ADL5902. RMS(VSIG) = √(Mean(VSIG2)) = √(VATG2) = VATG (5) The input impedance is set primarily by an internal 2 kΩ resistor connected between INHI and INLO. A dc level of approximately Substituting the value of V from Equation 2 results in SIG half the supply voltage on each pin is established internally. Either RMS(G0 × RFIN e (VSET/VGNS)) = VATG (6) the INHI or INLO pin can be used as the single-ended RF input When connected as a measurement device, V = V . Solving pin. Signal coupling capacitors must be connected from the input SET OUT for V as a function of RF , signal to the INHI and INLO pins. A single external 60.4 Ω resistor OUT IN to ground from the desired input creates an equivalent 50 Ω V = V × log (RMS(RF )/V ) (7) OUT SLOPE 10 IN Z impedance over a broad section of the operating frequency range. where: The other input pin must be RF ac-coupled to common (ground). V is 1.06 V/decade (or 53 mV/dB) at 2.14 GHz. SLOPE The input signal high-pass corner formed by the input coupling V is the intercept voltage. Z capacitor internal and external resistances is When RMS(RF ) = V , this implies that V = 0 V because IN Z OUT f = 1/(2 × π × 50 × C) (11) HIGHPASS log (1) = 0. This makes the intercept the input that forces V = 10 OUT where C is the capacitance in farads and f is in hertz. The 0 V if the ADL5902 had no sensitivity limit. The P (in HIGHPASS INTERCEPT input coupling capacitors must be large enough in value to pass decibels relative to 1 milliwatt, that is, dBm) corresponding to the input signal frequency of interest and determine the low end Vz (in volts) in ADL5902 is given by the following equation: of the frequency response. INHI and INLO can also be driven P = −(V /V ) + P (8) INTERCEPT PEDISTAL SLOPE MINDET differentially using a balun. where VPEDISTAL is the VSET interface pedestal voltage, and VBIAS P is the minimum detectable signal in decibels relative to MINDET 1 milliwatt, given by the following expression: VPOS ESD ESD P = dBm (V ) – G (9) MINDET ATG O 2kΩ 2kΩ where dBm(V ) is the equivalent power in decibels relative to ATG INHI INLO 1 milliwatt corresponding to a given V . TGT LOAD Combining Equation 8 and Equation 9 results in P = −(V /V ) + dBm (V ) – G (10) INTERCEPT PEDISTAL SLOPE ATG O For the ADL5902, V is approximately 0.275 V and V is ESD PEDISTAL ATG ESD ESD ESD ESD given by V /20. G is 45 dB below approximately 4 GHz and TGT O then VdeATcGr e=a s4e0s matV h i gher frequencies. VTGT = 0.8 V; therefore, COMM ESD ESD ESD ESD ESD ESD 08218-041 Figure 37. RF Inputs and Extensive ESD protection is employed on the RF inputs, and dBm (V ) = 10 log ((40 mV)2/50 Ω)/1 mW) ≈ −14.9 dBm ATG 10 this protection limits the maximum possible input to the ADL5902. At 2.14 GHz, V ≈ 53 mV/dB and G at 2.14 GHz = 45 dB. SLOPE O This results in a P ≈ −65 dBm. This differs slightly from INTERCEPT the value in Table 1 due to the choice of calibration points and the slight nonideality of the response. In most applications, the AGC loop is closed through the setpoint interface and the VSET pin. In measurement mode, VOUT is directly connected to VSET (see the Measurement Mode Basic Connections section for more information). In controller mode, a control voltage is applied to VSET, and the VOUT pin typically drives the control input of an amplification or attenuation system. In this case, the voltage at the VSET pin forces a signal amplitude at the RF inputs of the ADL5902 that balances the system through feedback. Rev. B | Page 16 of 28
Data Sheet ADL5902 SMALL SIGNAL LOOP RESPONSE VREF INTERFACE The ADL5902 uses a VGA in a loop to force a squared RF signal The VREF pin provides an internally generated voltage reference to be equal to a squared dc voltage. This nonlinear loop can be for the user. The VREF voltage is a temperature stable 2.3 V simplified and solved for a small signal loop response. The low- reference that is capable of sourcing 4 mA and sinking 50 μA pass corner pole is given by maximum. An external resistor can be connected from VREF to COMM to provide additional current sink capability. The voltage Freq ≈ 1.83 × I /(C ) (12) LP TGT LPF on this pin can drive the TADJ/PWDN and VTGT pins. where: VPOS I is in amperes. TGT C is in farads. INTERNAL LPF VOLTAGE Freq is in hertz. LP VREF I is derived from V ; however, I is a squared value of TGT TGT TGT V multiplied by a transresistance, namely TGT 16kΩ g is IaTpGpT r=o xgmim ×a VteTlyGT 12 8.9 μs; therefore, with V equal to the( 13) COMM 08218-143 m TGT Figure 39. VREF Interface Simplified Schematic typically recommended 0.8 V, I is approximately 12 μA. The TGT TEMPERATURE COMPENSATION INTERFACE value of this current varies with temperature; therefore, the small signal pole varies with temperature. However, because the RF While the ADL5902 has a highly stable measurement output squaring circuit and dc squaring circuit track with temperature, with respect to temperature using proprietary techniques, for there is no temperature variation contribution to the absolute value optimal performance, the output temperature drift must be of VOUT. compensated for using the TADJ pin. The absolute value of For CW signals, compensation varies with frequency and VTGT. Table 4 shows the recommended voltages for V to maintain a temperature drift Freq ≈ 67.7 × 10⁻⁶/(C ) (14) TADJ LP LPF error of typically ±0.5 dB or better over the intended temperature However, signals with large crest factors include low pseudo- range (−40°C < T < +85°C) when driven single-ended and A random frequency content that must be either filtered out or V = 0.8 V. TGT sampled and averaged out (see the Choosing a Value for C LPF section for more information). Table 4. Recommended VTADJ for Selected Frequencies Frequency V (V) R9 in Figure 54 (Ω) R12 in Figure 54 (Ω) TEMPERATURE SENSOR INTERFACE TADJ 100 MHz 0.5 1430 402 The ADL5902 provides a temperature sensor output with a scaling 700 MHz 0.4 1430 301 factor of the output voltage of approximately 4.9 mV/°C. The 900 MHz 0.4 1430 301 output is capable of sourcing 4 mA and sinking 50 μA maximum 1.9 GHz 0.4 1430 301 at 25°C. An external resistor can be connected from TEMP to 2.14 GHz 0.4 1430 301 COMM to provide additional current sink capability. The 2.6 GHz 0.45 1430 348 typical output voltage at 25°C is approximately 1.4 V. 3.5 GHz 0.5 1430 402 VPOS 5.8 GHz 0.95 1430 1007 INTERNAL The values in Table 4 are chosen to give the best drift VPAT performance at the high end of the usable dynamic range TEMP 12kΩ over the −40°C to +85°C temperature range. There is often a trade off in setting values, and optimizing for one area of the 4kΩ dynamic range can mean less than optimal drift performance at COMM 08218-042 other input amplitudes. Figure 38. TEMP Interface Simplified Schematic Rev. B | Page 17 of 28
ADL5902 Data Sheet Compensating the device for temperature drift using TADJ allows ~4.5 V (or ~V − 0.5 V), the TADJ/PWDN pin sinks approximately S for great flexibility. If the user requires minimum temperature 500 μA. The source used to disable the ADL5902 must have a drift at a given input power, a subset of the dynamic range, or sufficiently high current capability for this reason. Figure 33 even over a different temperature range than shown in this data shows the typical response times for various RF input levels. sheet, the V can be swept while monitoring V over the The output reaches within 0.1 dB of the steady-state value in TADJ OUT temperature at the frequency and amplitude of interest. The approximately 5 μs; however, the reference voltage is available to optimal V to achieve minimum temperature drift at a given full accuracy in a much shorter time. This wake-up response TADJ power and frequency is the value of V where the output has varies depending on the input coupling and C . TADJ LPF minimum movement. VPOS 2.83 ESD +125°C SHUTDOWN POWER-UP ESD 2.81 CIRCUIT CIRCUIT 7kΩ 7kΩ +105°C TADJ/ 200Ω 200Ω VREF +85°C PWDN 2.79 +55°C V (V)OUT2.77 +–2020°5C°°CC COMM ESD 200Ω ITCNEOTMMEPRPECERNEAPSTTAUTRIOEN 08218-076 Figure 41. TADJ/PWDN Interface Simplified Schematic –40°C VSET INTERFACE 2.75 The VSET interface has a high input impedance of 72 kΩ. The voltage at VSET is converted to an internal current used to set 2.73 0.1 0.2 0.3 0.V4TADJ (V0).5 0.6 0.7 0.8 08218-044 timhea itneltye r1n9a dl VB/GVA. gain. The VGA attenuation control is approx- Figure 40. Effect of VTADJ at Various Temperatures, 2.14 GHz, −10 dBm GAINADJUST Varying VTADJ has only a very slight effect on VOUT at device 54kΩ VSET temperatures near 25°C; however, the compensation circuit has more and more effect as the temperature departs farther 18kΩ from 25°C. 2.5kΩ The TADJ pin has a high input impedance and can be conven- ioefn VtlyRE dF ruivsienng f rao rmes aisnt oerx tdeirvniadle sro. uTracbel eo r4 f groivmes a snu agtgteenstueadte vdo vltaalguee ACOM 08218-149 divider values to generate the required voltage from V . The Figure 42. VSET Interface Simplified Schematic REF resistors are shown in the evaluation board schematic (see OUTPUT INTERFACE Figure 54). V does change slightly with temperature and also REF The ADL5902 incorporates rail-to-rail output drivers with pull- input RF amplitude; however, the amount of change is unlikely up and pull-down capabilities. The closed-loop, − 3dB bandwidth to result in a significant effect on the final temperature stability from the input of the output amplifier to the output with no load is of the RF measurement system. Typically, the temperature comp- approximately 58 MHz with a single-pole roll off of approximately ensation circuit responds only to voltages between 0 and V/2, S −20 dB/decade. The output noise is approximately 25 nV/√Hz or about 2.5 V when V = 5 V. S at 100 kHz. The VOUT pin can source and sink up to 10 mA. Figure 41 in the Power-Down Interface section shows a simpli- There is also an internal load from VOUT to COMM of 2500 Ω. fied schematic representation of the TADJ/PWDN interface. VPOS POWER-DOWN INTERFACE ESD The quiescent and disabled currents for the ADL5902 at 25°C are approximately 73 mA and 300 μA, respectively. The dual CLPF 2pF function TADJ/PWDN pin is connected to the temperature comp- ensation circuit as well as the power-down circuit. Typically, the VOUT temperature compensation circuit responds only to voltages ESD 2kΩ between 0 and V/2, or about 2.5 V when V = 5 V. S S ESD 500Ω iWs fhuelnly t hpeo wvoelrteadge d oonw tnh.i sF piginu ries g3r2e astheor wthsa tnh Vis Sc −h a0r.1a cVt,e trhiset idce avsic ae COMM 08218-045 function of VPWDN. Note that, because of the design of this section Figure 43. VOUT Interface Simplified Schematic of the ADL5902, as V passes through a narrow range at PWDN Rev. B | Page 18 of 28
Data Sheet ADL5902 VTGT INTERFACE An example of this type of plot is Figure 3. The slope and intercept that form the ideal line are those at 25°C with CW The target voltage can be set with an external source or by modulation. Figure 21 and Figure 24 show the error with various connecting the VREF pin (nominally 2.3 V) to the VTGT pin popular forms of modulation with respect to the ideal CW line. through a resistive voltage divider. With 0.8 V on the VTGT pin, This method for calculating error is accurate, assuming that the rms voltage that must be provided by the VGA to balance the each device is calibrated at room temperature. AGC feedback loop is 0.8 V × 0.05 = 40 mV rms. Most of the characterization information in this data sheet was collected at In the second plot format, the VOUT voltage at a given input V = 0.8 V. Voltages higher and lower than this can be used; amplitude and temperature is subtracted from the corresponding TGT however, doing so increases or decreases the gain at the internal VOUT at 25°C and then divided by the 25°C slope to obtain an error squaring cell, which results in a corresponding increase or decrease in decibels. This type of plot does not provide any information in intercept. This, in turn, affects the sensitivity and the usable on the linear-in-dB performance of the device; it merely shows measurement range, in addition to the sensitivity to different the decibel equivalent of the deviation of VOUT over temperature, carrier modulation schemes. As V decreases, the squaring given a calibration at 25°C. When calculating error from any TGT circuits produce more noise; this becomes noticeable in the output one particular calibration point, this error format is accurate. It response at low input signal amplitudes. As V increases, is accurate over the full range shown on the plot assuming that TGT measurement error due to modulation increases and temperature enough calibration points are used. Figure 6 shows this plot type. drift tends to decrease. The chosen V value of 0.8 V represents a TGT The error calculations for Figure 30 are similar to those for the compromise between these characteristics. V plots. The slope and intercept of the V function vs. OUT TEMP VPOS temperature are determined and applied as follows: ESD Error (°C) = (V − Slope × (Temp − T ))/Slope (16) TEMP Z g × X2 ITGT where: VTGT 50kΩ T is the x-axis intercept expressed in degrees Celsius (the temp- Z ESD erature that results in a VTEMP of 0 V if possible). 50kΩ Temp is the ambient temperature of the ADL5902 in degrees ESD 10kΩ Celsius. COMM 08218-048 SVlToEpMeP iiss, tthyep ivcoalltlay,g 4e .a9t mthVe /T°CE.M P pin at that temperature. Figure 44. VTGT Interface MEASUREMENT MODE BASIC CONNECTIONS BASIS FOR ERROR CALCULATIONS Figure 45 shows the basic connections for operating the ADL5902 The slope and intercept used in the error plots are calculated using as they are implemented on the device evaluation board. The the coefficients of a linear regression performed on data collected ADL5902 requires a single supply of nominally 5 V. The supply in the central operating range. The error plots in the Typical is connected to the two VPOS supply pins. These pins must Performance Characteristics section are shown in two formats: each be decoupled using the two capacitors with values equal or error from the ideal line and error with respect to the 25°C output similar to those shown in Figure 45. These capacitors must be voltage. The error from the ideal line is the decibel difference in placed as close as possible to the VPOS pins. V from the ideal straight-line fit of V calculated by the OUT OUT An external 60.4 Ω resistor (R3) combines with the relatively high linear-regression fit over the linear range of the detector, typically RF input impedance of the ADL5902 to provide a broadband 50 Ω at 25°C. The error in decibels is calculated by match. An ac coupling capacitor must be placed between this Error (dB) = (VOUT − Slope × (PIN − PZ))/Slope (15) resistor and INHI. The INLO input must be ac-coupled to ground where P is the x-axis intercept expressed in decibels relative to using the same value capacitor. Because the ADL5902 has a Z 1 milliwatt (the input amplitude produces a 0 V output if such an minimum input operating frequency of 50 MHz, 100 pF ac output is possible). coupling capacitors can be used. The error from the ideal line is not a measure of absolute accuracy The ADL5902 is placed in measurement mode by connecting because it is calculated using the slope and intercept of each device. VOUT to VSET. In measurement mode, the output voltage is However, it verifies the linearity and the effect of temperature proportional to the log of the rms input signal level. and modulation on the response of the device. Rev. B | Page 19 of 28
ADL5902 Data Sheet VPOS +5V GND C3 (RED) C7 (BLACK) 0.1µF 0.1µF C4 C5 100pF 100pF TEMP (BLACK) VPOS POS 3 10 VSET ADL5902 TEMSPEENRSAOTRURE 8 TEMP (BLACK) C10 VSET 100pF 7 INHI R2 RFIN 14 IDET OPEN R3 INLO X2 60.4Ω 15 C12 100pF LINEAR-IN-dB VGA R6 (NEGATIVE SLOPE) 0Ω X2 ITGT R1 NC 2 G = 5 6 VOUT 0Ω VOUT (BLACK) R15 OPEN NC 16 BIAS AND POWER- VREF DOWN CONTROL 2.3V CLPF NC 13 5 C9 26pF 10µF 1 11 12 9 4 TADJ/PWDN VREF VTGT COMM COMM TC2 PWDN (BLACK) 30R11Ω2 14R390Ω 3.R741k0Ω R11 V(BTLGATCK) (BVLRAECFK) 2kΩ 08218-145 Figure 45. Basic Connections for Operation in Measurement Mode SETTING V SETTING V TADJ TGT As discussed in the Theory of Operation section, the output As discussed in the Theory of Operation section, setting the temperature drift must be compensated by applying a voltage to voltage on VTGT to 0.8 V represents a compromise between the TADJ pin. The compensating voltage varies with frequency. achieving excellent rms compliance and maximizing dynamic The voltage for the TADJ pin can be easily derived from a resistor range. The voltage on VTGT can be derived from the VREF pin divider connected to the VREF pin. Table 5 shows the recom- using a resistor divider as shown Figure 45 (Resistor R10 and mended V for operation from −40°C to +85°C, along with Resistor R11). Like the resistors chosen to set the V voltage, TADJ TADJ resistor divider values. Resistor values are chosen so that they the resistors setting V must have reasonable values that do TGT neither pull too much current from VREF (VREF short-circuit not pull too much current from VREF or cause bias current current is 4 mA) nor are so large that the TADJ pin bias current of errors. Also, attention must be paid to the combined current 3 μA affects the resulting voltage at the TADJ pin. that VREF must deliver to generate the V and V voltages. TADJ TGT This current must be kept well below the VREF short-circuit Table 5. Recommended V for Selected Frequencies TADJ current of 4 mA. Frequency V (V) R9 (Ω) R12 (Ω) TADJ CHOOSING A VALUE FOR C 100 MHz 0.5 1430 402 LPF 700 MHz to 2.14 GHz 0.4 1430 301 CLPF (C9 in Figure 45) provides the averaging function for the 2.6 GHz 0.45 1430 348 internal rms computation. Using the minimum value for CLPF 3.5 GHz 0.5 1430 402 allows the quickest response time to a pulsed waveform but 5.8 GHz 0.95 1430 1007 leaves significant output noise on the output voltage signal. By the same token, a large filter cap reduces output noise but at the expense of response time. For non response-time critical applications, a relatively large capacitor can be placed on the CLPF pin. In Figure 45, a value of 0.1 μF is used. For most signal modulation schemes, this value ensures excellent rms measurement compliance and low residual output noise. There is no maximum capacitance limit for C . LPF Rev. B | Page 20 of 28
Data Sheet ADL5902 Figure 46 shows how output noise varies with C when the In applications where the response time is critical, a different LPF ADL5902 is driven by a single-carrier W-CDMA signal (Test approach to signal filtering can be taken. This is shown in Model TM1-64, peak envelope power = 10.56 dB, bandwidth = Figure 47. The capacitor on the CLPF pin is set to the minimum 3.84 MHz). With a 10 μF capacitor on CLPF, there is residual value that ensures that a valid rms computation is performed. noise on V of 4.4 mV p-p, which is less than 0.1 dB error The job of noise removal is then handed off to an RC filter on OUT (assuming a slope of approximately 53 mV/dB). the VOUT pin. This approach ensures that there is enough 300 1M averaging to ensure good rms compliance and does not burden OUTPUT NOISE (mV p-p) 10% TO 90% RISE TIME (µs) the rms computation loop with extra filtering that significantly 90% TO 10% FALL TIME (µs) 250 100k slows down the response time. By finishing the filtering process using an RC filter after VOUT, faster fall times can be achieved p) UT NOISE (mV p- 125000 11k0k E/FALL TIME (µs) wtaInhfit ateFhtri g t athuhnere eeR aq4Cnu7a ,if vlCiolatLglePe-Frn t iocst -aeadnqmi ugaoailtsula otnlo btc 1eoo0 nfi mnvoeFupr.t ltTpeeumhr.ti s en nvotaielsudee .i nwIt atmhs eeu xsdpti egbrieitm anl oedntoetadml layi n UTP 100 100 RIS determined to be the minimum capacitance that ensures good O rms compliance when the ADL5902 is driven by a 1 C W-CDMA 50 10 signal (TM1-64). This test was carried out by starting out with a large capacitance value on the CLPF pin (for example, 10 μF). 0 1 1 10 CLPF (nF) 100 1000 08218-146 Texhaem vpalleu,e − o1f0 V dOBUmT w).a Ths neo tveadlu feo ro fa CfiLxPeF dw iansp tuhte pno pwreorg rleevsseilv (efloyr Figure 46. Output Noise, Rise and Fall Times vs. CLPF Capacitance, Single- reduced (this can be done with press-down capacitors) until Carrier W-CDMA (TM1-64) at 2.14 GHz with PIN = 0 dBm the value of VOUT started to deviate from the original value (this Figure 46 also shows how C affects the response time of V . indicates that the accuracy of the rms computation is degrading LPF OUT To measure this, a RF burst at 2.14 GHz at −10 dBm was applied to and that CLPF is getting too small). the ADL5902. The 10% to 90% rise time and 90% to 10% fall time is then measured. It is notable that the fall time is much longer than the rise time. This can also be seen in the response time plots, Figure 22, Figure 23, Figure 25, and Figure 26. VPOS POS 3 10 ADL5902 TEMPERATURE 8 TEMP SENSOR VSET 7 INHI 14 IDET X2 INLO 15 LINEAR-IN-dB VGA (NEGATIVE SLOPE) X2 ITGT RFILTER NC 2 G = 5 6 2kΩ VOUT VOUT CFILTER (SEE FIGURE 48.) NC 16 BIAS AND POWER- VREF DOWN CONTROL 2.3V NC 13 5 CLPF C109nF 26pF (SEE TABLE 6 AND FIGURE 46.) 1 11 12 9 4 TADJ/PWDN VREF VTGT COMM COMM 08218-147 Figure 47. Optimizing Setting Time and Residual Ripple Rev. B | Page 21 of 28
ADL5902 Data Sheet Figure 48 shows the resulting rise and fall times (signal is pulsed For large values of C , the fall time is dramatically reduced FILTER between off and −10 dBm) with CLPF equal to 10 nF. A 2 kΩ compared to Figure 46. This comes at the expense of a moderate resistor is placed in series with the VOUT pin, and the capacitance increase in rise time. from this resistor to ground (CFILTER in Figure 47) is varied As C is reduced, the fall time flattens out. This is because FILTER up to 1 μF. the fall time is now dominated by the 10 nF C which is LPF 300 1M present throughout the measurement. RESIDUAL RIPPLE (V p-p) 10% TO 90% RISE TIME (µs) 250 90% TO 10% FALL TIME (µs) 100k Table 6 shows recommended minimum values of CLPF for popular modulation schemes, using just a single filter capacitor p) p- at the CLPF pin. Using lower capacitor values results in rms E (mV 200 10k ME (µs) measurement errors. Output response time (10% to 90%) is also PL TI shown. If the output noise shown in Table 6 is unacceptably AL RIPSIDU 110500 110k0 RISE/FALL h igh,I nitc craenas bineg r eCdLuPFc ed by RE Adding an RC filter at VOUT, as shown in Figure 47 50 10 Implementing an averaging algorithm after the ADL5902 output voltage is digitized by an ADC 0 1 1 10 CFILTER (nF) 100 1k 08218-148 Figure 48. Residual Ripple, Rise and Fall Times Using an RC Low-Pass Filter at VOUT, PIN = 0 dBm at 2.14 GHz Table 6. Recommended Minimum CLPF Values for Various Modulation Schemes Peak-Envelope Signal Modulation/Standard Power Bandwidth C (min) Output Noise Rise/Fall Time (10% to 90%) LPF W-CDMA, One-Carrier, TM1-64 10.56 dB 3.84 MHz 10 nF 95 mV p-p 12/330 s W-CDMA Four-Carrier, TM1-64, TM1-32, 12.08 dB 18.84 MHz 5.6 nF 164 mV p-p 7/200 s TM1-16, TM1-8 LTE, TM1 1CR 20 MHz (2048 Subcarriers, 11.58 dB 20 MHz 1000 pF 452 mV p-p 1.3/38 s QPSK Subcarrier Modulation) Rev. B | Page 22 of 28
Data Sheet ADL5902 OUTPUT VOLTAGE SCALING Table 7. Output Voltage Range Scaling Desired Nominal The output voltage range of the ADL5902 (nominally 0.3 V to Input New Output 3.5 V) can be easily increased or decreased. There are a number Range R6 R2 R1 R15 Slope Voltage of situations where adjustment of the output scaling makes sense. (dBm) (Ω) (Ω) (Ω) (Ω) (mV/dB) Range (V) For example, if the ADL5902 is driving an analog-to-digital 0 to −60 665 2000 72.1 0.195 to 4.52 converter (ADC) with a 0 V to 5 V input range, it makes sense −10 to −50 1180 2000 86.3 1.096 to 4.55 0 to −60 806 2000 38.3 0.103 to 2.49 to increase the detector nominal maximum output voltage of −10 to −50 324 2000 46.2 0.587 to 2.43 3.5 V so that it is closer to 5 V. This makes better use of the input range of the ADC and maximizes the resolution of the system Equation 17 is the general function that governs this. in terms of bits/dB. For more information on interfacing the V' ADL5902 to an ADC, please refer to Circuit Note CN0178. R6(R2||RIN)VOO 1 (17) If only a part of the ADL5902 RF input power range is being used (for example, −10 dBm to −60 dBm), it can make sense to where: increase the scaling so that this reduced input range fits into the V is the nominal maximum output voltage (see Figure 6 O ADL5902 available output swing of 0 V to 4.8 V. through Figure 18). V' is the new maximum output voltage (for example, up to 4.8 V). The output swing can also be reduced by simply adding a O R is the VSET input resistance (72 kΩ). voltage divider on the output pin, as shown in the circuit on the IN left-hand side of Figure 49. Reducing the output scaling can, for When choosing R6 and R2, attention must be paid to the current example, be used when interfacing the ADL5902 to an ADC drive capability of the VOUT pin and the input resistance of the with a 0 V to 2.5 V input range. Recommended scaling resistors VSET pin. The choice of resistors must not result in excessive for a slope decrease are provided in Table 7. current draw out of VOUT. However, making R6 and R2 too large is also problematic. If the value of R2 is compatible with the The output voltage swing can be increased using a technique input resistance of the VSET input (72 kΩ), this input resistance, that is analogous to setting the gain of an op amp in noninverting which varies slightly from device to device, contributes to the mode with the VSET pin being the equivalent of the inverting resulting slope and output voltage. In general, the value of R2 input of the op amp. This is shown in the circuit on the left-hand must be at least ten times smaller than the input resistance of side of Figure 49. VSET. Values for R6 and R2 must, therefore, be in the 1 kΩ to Connecting VOUT to VSET results in the nominal 0 V to 3.5 V 5 kΩ range. swing and a slope of approximately 53 mV/dB (this varies slightly It is also important to take into account device to device and with frequency). Figure 49 and Table 7 show the configurations frequency variation in output swing along with the ADL5902 for increasing the slope, along with recommended standard output stage maximum output voltage of 4.8 V. The V resistor values for particular input ranges and output swings. OUT distribution is well characterized at major frequencies’ bands in the Typical Performance Characteristics section (see Figure 6 through Figure 8, Figure 12 through Figure 14, Figure 18, and Figure 19). The resistor values in Table 7, which are calculated R2 7 VSET 7 VSET based on 900 MHz performance, are conservatively chosen so that there is no chance that the output voltages exceed the R6 ADL5902 output swing or the input range of a 0 V to 2.5 V and VOUT R1 VOUT 6 6 0 V to 5 V ADC. Because the output swing does not vary much R15 with frequency (it does start to drop off above 3 GHz), these 08218-049 v alues work for multiple frequencies. Figure 49. Decreasing and Increasing Slope Rev. B | Page 23 of 28
ADL5902 Data Sheet SYSTEM CALIBRATION AND ERROR CALCULATION Figure 50 includes a plot of this error when using a two-point calibration (calibration points are 0 dBm and −40 dBm). The The measured transfer function of the ADL5902 at 2.14 GHz is error at the calibration points (in this case, −40 dBm and 0 dBm) shown in Figure 50, which contains plots of both output voltage is equal to 0 by definition. vs. input amplitude (power) and calculated error vs. input level. As the input level varies from −62 dBm to +3 dBm, the output The residual nonlinearity of the transfer function that is voltage varies from ~0.25 V to ~3.5 V. apparent in the two-point calibration error plot can be reduced by increasing the number of calibration points. Figure 50 shows 6 6 VOUT 5 the postcalibration error plots for three-point and four-point ERROR 2-POINT CAL AT 0dBm, AND 40dBm 5 ERROR 3-POINT CAL AT 0 dBm, 4 calibrations. With a multipoint calibration, the transfer function –45dBm, AND 60dBm ERROR 4-POINT CAL AT 0dBm, –20dBm, 3 is segmented, with each segment having a slope and intercept. –45dBm, AND –60dBm 4 2 Multiple known power levels are applied, and multiple voltages are (V)UT 3 01 OR (dB) mvoeltaasguer efrdo. mW thheen d tehtee cetqouri pfimrset ndte itse rimn oinpeesr awthioinch, tohfe t mhee satsourreedd VO –1 RR slope and intercept calibration coefficients are to be used. Then E 2 –2 the unknown power level is calculated by inserting the –3 appropriate slope and intercept into Equation 21. 1 –4 Figure 51 shows the output voltage and error at 25°C and over –5 temperature when a four-point calibration is used (calibration 0 –6 –70 –60 –50 –40 PIN –(3d0Bm) –20 –10 0 10 08218-050 pchooinotssi nagre c 0a ldibBrmat,i o−n2 0p odiBnmts,, t−h4e5r ed iBs mno, arneqdu −ir6e0m deBnmt f)o. rW, ohre n Figure 50. 2.14 GHz Transfer Function, Using Various Calibration Techniques value, in equal spacing between the points. There is also no limit to the number of calibration points used. However, using Because slope and intercept vary from device to device, board- more calibration points increases calibration time. level calibration must be performed to achieve high accuracy. The equation for the idealized output voltage can be written as 6 6 +85°C VOUT +25°C VOUT 5 VOUT(IDEAL) = Slope × (PIN − Intercept) (18) 5 –+4805°°CC VEORURTOR 4-POINT CAL 4 +25°C ERROR 4-POINT CAL AT 0dBm, where: –20dBm, –45dBm, AND –60dBm 3 –40°C ERROR 4-POINT CAL Slope is the change in output voltage divided by the change in 4 2 iInnpteurtc eppotw ise trh (ed Bca)l.c ulated input power level at which the output (V)UT 3 01 OR (dB) O R voltage is 0 V (note that Intercept is an extrapolated theoretical V –1 R E value not a measured value). 2 –2 –3 In general, calibration is performed during equipment manu- 1 –4 facture by applying two or more known signal levels to the –5 input of the ADL5902 and measuring the corresponding output 0 –6 vino-ldtaBg eosp. eTrhatei ncagl irbarnagteio onf pthoein dtes vaircee .g enerally within the linear- –70 –60 –50 –40 PIN –(3d0Bm) –20 –10 0 10 08218-051 Figure 51. 2.14 GHz Transfer Function and Error at +25°C, −40°C, and +85°C With a two-point calibration, the slope and intercept are Using a Four-Point Calibration (0 dBm, −20 dBm, −45 dBm, −60 dBm) calculated as follows: The −40°C and +85°C error plots in Figure 51 are generated Slope = (V − V )/(P − P ) (19) OUT1 OUT2 IN1 IN2 using the 25°C calibration coefficients. This is consistent with Intercept = PIN1 − (VOUT1/Slope) (20) equipment calibration in a mass production environment where calibration at just a single temperature is practical. After the slope and intercept are calculated and stored in non- volatile memory during equipment calibration, an equation can calculate an unknown input power based on the output voltage of the detector. P (Unknown) = (V /Slope) + Intercept (21) IN OUT1(MEASURED) The log conformance error is the difference between this straight line and the actual performance of the detector. Error (dB) = (V − V )/Slope (22) OUT(MEASURED) OUT(IDEAL) Rev. B | Page 24 of 28
Data Sheet ADL5902 HIGH FREQUENCY PERFORMANCE DESCRIPTION OF CHARACTERIZATION The ADL5902 is specified to 6 GHz; however, operation is The general hardware configuration used for most of the ADL5902 possible to as high as 9 GHz with sufficient dynamic range for characterization is shown in Figure 53. The ADL5902 was driven in many purposes. Figure 52 shows the typical V response and a single-ended configuration for most characterization, except OUT conformance error at 7 GHz, 8 GHz, and 9 GHz. where noted. 3.00 6 Much of the data was taken using an Agilent E4438C signal source 7GHz 2.75 8GHz 5 as a RF input stimulus. Several ADL5902 devices mounted on 9GHz 2.50 4 circuit boards constructed of Rodgers 3006 material are put into 2.25 3 a test chamber simultaneously, and a Keithley S46 RF switching V) E ( 2.00 2 network connected the signal source to the appropriate device VOLTAG 11..5705 01 OR (dB) uthned aeprp treospt.r iTahtee t teemstp cehraatmurbee rra tnegme.p Tehrae tsuigren awl asso userct et,o s wcyitcclhe ionvge, r PUT 1.25 –1 ERR and chamber temperature are all controlled by a PC running UT 1.00 –2 Agilent VEE Pro. O 0.75 –3 The subsequent response to stimulus was measured with a 0.50 –4 voltmeter and the results stored in a database for analysis later. 0.25 –5 In this way, multiple ADL5902 devices are characterized over 0 –6 –50 –40 –30 PIN –(2d0Bm) –10 0 10 08218-057 aomf tpimliteu. dTeh, efr ReqFu setnimcyu, launsd a mtemplipteurdaet uwrea si nc aal imbriantiemd uump taom thoeu nt Figure 52. Typical VOUT and Log Conformance Error at 7 GHz, 8 GHz, circuit board that carries the ADL5902, and, thus, it does not and 9 GHz, 25°C Only account for the slight losses due to the connector on the circuit LOW FREQUENCY PERFORMANCE board that carries the ADL5902 nor for the loss of traces on the The lowest frequency of operation of the ADL5902 is approxi- circuit board. For this reason, there is a small absolute amplitude mately 50 MHz. This is the result of the circuit design and error (generally <0.5 dB) not accounted for in the characterization architecture of the ADL5902. data, but this is generally not important because the ADL5902 relative accuracy is unaffected. AGILENT E3631A AGILENT 34980A DC POWER SWITCH MATRIX/ SUPPLIES DC METER ADL5902 CHARACTERIZATION BOARD – TEST SITE 1 AGILENT E8251A KEITHLEY S46 MICROWAVE MICROWAVE ADL5902 SIGNAL SWITCH CHARACTERIZATION GENERATOR BOARD – TEST SITE 2 ADL5902 PERSONAL CHARACTERIZATION COMPUTER BOARD – TEST SITE 3 RF DC DATAAND CONTROL 08218-075 Figure 53. General Characterization Configuration Rev. B | Page 25 of 28
ADL5902 Data Sheet EVALUATION BOARD SCHEMATICS AND ARTWORK VPOS +5V GND C3 (RED) C7 (BLACK) 0.1µF 0.1µF C4 C5 100pF 100pF TEMP (BLACK) VPOS POS 3 10 VSET ADL5902 TEMSPEENRSAOTRURE 8 TEMP (BLACK) C10 VSET 100pF 7 INHI R2 RFIN 14 IDET OPEN R3 INLO X2 60.4Ω 15 C12 100pF LINEAR-IN-dB VGA R6 (NEGATIVE SLOPE) 0Ω X2 ITGT R1 NC 2 G = 5 6 VOUT 0Ω VOUT (BLACK) R15 OPEN NC 16 BIAS AND POWER- VREF DOWN CONTROL 2.3V CLPF NC 13 5 C9 26pF 10µF 1 11 12 9 4 TADJ/PWDN VREF VTGT COMM COMM TC2 PWDN (BLACK) 30R11Ω2 14R390Ω 3.R741k0Ω R11 V(BTLGATCK) (BVLRAECFK) 2kΩ 08218-150 Figure 54. Evaluation Board Schematic Table 8. Evaluation Board Configuration Options Component Function/Notes Default Value C10, C12, R3 RF input. The ADL5902 is generally driven single-ended. R3 is the input termination resistor and is C10 = C12 = 100 pF chosen to give a 50 Ω input impedance over a broad frequency range. R3 = 60.4 Ω R10, R11 VTGT interface. R10 and R11 are set up to provide 0.8 V to VTGT derived from VREF. R10 = 3.74 kΩ, R11 = 2 kΩ C4, C5, C7, C3 Power supply decoupling. The nominal supply decoupling consists of two pairs of 100 pF and C4 = C5 = 100 pF, 0.1 μF capacitors placed close to the two power supply pins of the ADL5902. C7 = C3 = 0.1 μF R1, R15, R2, Output interface. In measurement mode, a portion of the voltage at the VOUT pin is fed back to R1 = R6= 0 Ω, R6 the VSET pin via R6. Using the voltage divider created by R2 and R6, the magnitude of the slope R2 = R15 = open of V is increased by reducing the portion of V that is fed back to V . In controller mode, R6 OUT OUT SET must be open. In this mode, the ADL5902 can control the gain of an external component. A setpoint voltage is applied to the VSET pin, the value of which corresponds to the desired RF input signal level applied to the ADL5902. C9 Low-pass filter capacitors, C . The low-pass filter capacitor provides the averaging for the C9 = 0.1 μF LPF ADL5902 rms computation. R9, R12 TADJ/PWDN. The TADJ/PWDN pin controls the amount of nonlinear intercept temperature R9 = 1430 Ω compensation and/or shuts down the device. The evaluation board is configured with TADJ R12 = 301 Ω connected to VREF through a resistor divider (R9, R12). Rev. B | Page 26 of 28
Data Sheet ADL5902 ASSEMBLY DRAWINGS 08218-060 08218-061 Figure 55. Evaluation Board Layout, Top Side Figure 56. Evaluation Board Layout, Bottom Side Rev. B | Page 27 of 28
ADL5902 Data Sheet OUTLINE DIMENSIONS 4.10 0.35 4.00 SQ 0.30 PIN 1 3.90 0.25 INDICATOR PIN 1 0.65 13 16 INDICATOR BSC 12 1 *2.40 EXPPAODSED 2.35 SQ 2.30 9 4 0.50 8 5 0.25 MIN TOP VIEW 0.40 BOTTOM VIEW 0.30 0.80 FOR PROPER CONNECTION OF 0.75 THE EXPOSED PAD, REFER TO 0.05 MAX THE PIN CONFIGURATION AND 0.70 0.02 NOM FUNCTION DESCRIPTIONS SECTION OF THIS DATA SHEET. COPLANARITY SEATING 0.08 PKG-000000 PLANE *CWOITMHP ELIXACNETPTTOIOJNE D0T.EO2C0 T RSHETEFA ENXDPAORSDESD M POA-D2.20-WGGC-3 07-21-2015-B Figure 57. 16-Lead Lead Frame Chip Scale Package [LFCSP] 4 mm × 4 mm Body and 0.75 mm Package Height (CP-16-20) Dimensions shown in millimeters ORDERING GUIDE Model1 Temperature Range Package Description Package Option Ordering Quantity ADL5902ACPZ-R7 −40°C to +125°C 16-Lead Lead Frame Chip Scale Package [LFCSP] CP-16-20 1,500 ADL5902ACPZ-R2 −40°C to +125°C 16-Lead Lead Frame Chip Scale Package [LFCSP] CP-16-20 250 ADL5902ACPZ-WP −40°C to +125°C 16-Lead Lead Frame Chip Scale Package [LFCSP] CP-16-20 64 ADL5902-EVALZ Evaluation Board 1 Z = RoHS Compliant Part. ©2010–2016 Analog Devices, Inc. All rights reserved. Trademarks and registered trademarks are the property of their respective owners. D08218-0-8/16(B) Rev. B | Page 28 of 28
Mouser Electronics Authorized Distributor Click to View Pricing, Inventory, Delivery & Lifecycle Information: A nalog Devices Inc.: ADL5902ACPZ-R7 ADL5902-EVALZ EVAL-ADL5902-ARDZ