ICGOO在线商城 > 集成电路(IC) > 线性 - 放大器 - 仪表,运算放大器,缓冲器放大器 > OPA2683IDCNT

 Datasheet下载
- 型号: OPA2683IDCNT
- 制造商: Texas Instruments
- 库位|库存: xxxx|xxxx
- 要求:
| 数量阶梯 | 香港交货 | 国内含税 |
| +xxxx | $xxxx | ¥xxxx |
查看当月历史价格
查看今年历史价格
OPA2683IDCNT产品简介:
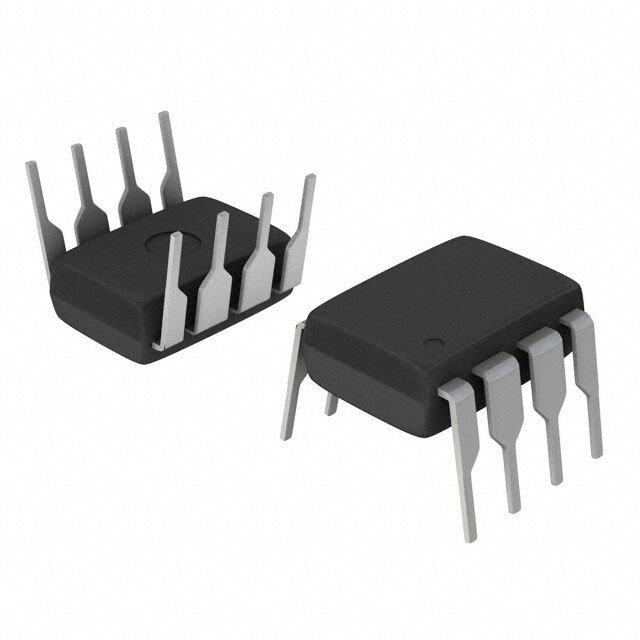
ICGOO电子元器件商城为您提供OPA2683IDCNT由Texas Instruments设计生产,在icgoo商城现货销售,并且可以通过原厂、代理商等渠道进行代购。 OPA2683IDCNT价格参考¥18.34-¥34.06。Texas InstrumentsOPA2683IDCNT封装/规格:线性 - 放大器 - 仪表,运算放大器,缓冲器放大器, 电流反馈 放大器 2 电路 SOT-23-8。您可以下载OPA2683IDCNT参考资料、Datasheet数据手册功能说明书,资料中有OPA2683IDCNT 详细功能的应用电路图电压和使用方法及教程。
OPA2683IDCNT 是 Texas Instruments(德州仪器)推出的一款高性能运算放大器,属于线性放大器类别,适用于多种精密信号处理场景。

该器件主要应用于:

1. 通信系统:OPA2683IDCNT 具有高带宽和低失真特性,适合用于通信设备中的信号放大和处理,如无线基站、光纤通信模块等。

2. 测试与测量设备:其高精度、低噪声特性使其广泛用于示波器、信号发生器、频谱分析仪等精密仪器中,用于提升测量精度和信号完整性。

3. 工业控制系统:在工业自动化中,可用于传感器信号调理、模拟信号放大和滤波处理,提高系统稳定性和响应速度。

4. 医疗设备:如心电图仪、超声设备等,用于放大微弱生物电信号,确保信号的高保真传输。

5. 音频设备:因其低失真和高保真特性,也可用于高端音频放大系统中,提升音频输出质量。

6. 高速数据采集系统:作为缓冲器或前置放大器,用于高速ADC(模数转换器)前端,提高信号采集精度和速度。

该器件采用小型封装,适用于空间受限的设计,同时具备良好的温度稳定性和功耗控制,适合高可靠性应用场景。
| 参数 | 数值 |
| -3db带宽 | 200MHz |
| 产品目录 | 集成电路 (IC)半导体 |
| 描述 | IC OPAMP CFA 1.44GHZ SOT23-8高速运算放大器 Very Low Power Dual Current Feedback |
| 产品分类 | Linear - Amplifiers - Instrumentation, OP Amps, Buffer Amps集成电路 - IC |
| 品牌 | Texas Instruments |
| 产品手册 | |
| 产品图片 |
|
| rohs | 符合RoHS无铅 / 符合限制有害物质指令(RoHS)规范要求 |
| 产品系列 | 放大器 IC,高速运算放大器,Texas Instruments OPA2683IDCNT- |
| 数据手册 | |
| 产品型号 | OPA2683IDCNT |
| 产品 | Current Feedback Amplifier |
| 产品目录页面 | |
| 产品种类 | |
| 供应商器件封装 | SOT-23-8 |
| 共模抑制比—最小值 | 51 dB |
| 其它名称 | 296-14173-6 |
| 包装 | Digi-Reel® |
| 压摆率 | 540 V/µs |
| 商标 | Texas Instruments |
| 增益带宽积 | 1.44GHz |
| 安装类型 | 表面贴装 |
| 安装风格 | SMD/SMT |
| 封装 | Reel |
| 封装/外壳 | SOT-23-8 |
| 封装/箱体 | SOT-23-8 |
| 工作温度 | -40°C ~ 85°C |
| 工作电源电压 | 12 V |
| 工厂包装数量 | 250 |
| 拓扑结构 | Current Feedback |
| 放大器类型 | 电流反馈 |
| 最大工作温度 | + 85 C |
| 最小工作温度 | - 40 C |
| 标准包装 | 1 |
| 电压-电源,单/双 (±) | 5 V ~ 12 V, ±2.5 V ~ 6 V |
| 电压-输入失调 | 1.5mV |
| 电流-电源 | 1.88mA |
| 电流-输入偏置 | 3µA |
| 电流-输出/通道 | 150mA |
| 电源电压-最大 | 12 V |
| 电源电压-最小 | 4 V |
| 电源电流 | 2.06 mA |
| 电路数 | 2 |
| 系列 | OPA2683 |
| 设计资源 | http://www.digikey.com/product-highlights/cn/zh/texas-instruments-webench-design-center/3176 |
| 转换速度 | 210 V/us |
| 输入补偿电压 | 3.5 mV |
| 输出类型 | - |
| 通道数量 | 2 Channel |
| 配用 | /product-detail/zh/DEM-OPA-SOT-2A/296-22747-ND/1739778 |


- 商务部:美国ITC正式对集成电路等产品启动337调查
- 曝三星4nm工艺存在良率问题 高通将骁龙8 Gen1或转产台积电
- 太阳诱电将投资9.5亿元在常州建新厂生产MLCC 预计2023年完工
- 英特尔发布欧洲新工厂建设计划 深化IDM 2.0 战略
- 台积电先进制程称霸业界 有大客户加持明年业绩稳了
- 达到5530亿美元!SIA预计今年全球半导体销售额将创下新高
- 英特尔拟将自动驾驶子公司Mobileye上市 估值或超500亿美元
- 三星加码芯片和SET,合并消费电子和移动部门,撤换高东真等 CEO
- 三星电子宣布重大人事变动 还合并消费电子和移动部门
- 海关总署:前11个月进口集成电路产品价值2.52万亿元 增长14.8%


PDF Datasheet 数据手册内容提取
OPA2683 OPA2683 OPA2683 www.ti.com SBOS244H – MAY 2002 – REVISED JULY 2009 Very Low-Power, Dual, Current-Feedback Operational Amplifier FEATURES APPLICATIONS (cid:1) REDUCED BANDWIDTH CHANGE VERSUS GAIN (cid:1) LOW-POWER BROADCAST VIDEO DRIVERS (cid:1) 150MHz BANDWIDTH G = +2 (cid:1) µPOWER ACTIVE FILTERS (cid:1) > 80MHz BANDWIDTH TO GAIN > +10 (cid:1) SHORT-LOOP ADSL CO DRIVERS (cid:1) LOW DISTORTION: < –65dBc at 5MHz (cid:1) MULTICHANNEL SUMMING AMPLIFIERS (cid:1) HIGH OUTPUT CURRENT: 110mA (cid:1) PROFESSIONAL CAMERAS (cid:1) SINGLE-SUPPLY OPERATION: +5V to +12V (cid:1) DIFFERENTIAL ADC INPUT DRIVERS (cid:1) DUAL-SUPPLY OPERATION: ±2.5V to ±6V (cid:1) LOW SUPPLY CURRENT: 1.9mA Total (cid:1) POWER SHUTDOWN VERSION: MSOP-10 DESCRIPTION flexibility allows frequency response peaking elements to be added, multiple input inverting summing circuits to have greater The OPA2683 provides a new level of performance for dual, very bandwidth, and low-power differential line drivers to meet the low-power, wideband, current-feedback amplifiers. This CFB PLUS demanding requirements of DSL. amplifier is among the first to use an internally closed-loop input buffer stage that significantly enhances performance over earlier The output capability for the OPA2683 also sets a new mark in low-power, current-feedback (CFB) amplifiers. This new archi- performance for very low-power, current-feedback amplifiers. De- tecture provides many of the advantages of a more ideal CFB livering a full ±4VPP swing on ±5V supplies, the OPA2683 also has amplifier while retaining the benefits of very low-power operation. the output current to support this swing into a 100Ω load. This The closed-loop input stage buffer gives a very low and linearized minimal output headroom requirement is complemented by a impedance path at the inverting input to sense the feedback error similar 1.2V input stage headroom, giving exceptional capability for current. This improved inverting input impedance gives excep- single +5V operation. tional bandwidth retention to much higher gains and improved The OPA2683’s low 1.9mA total supply current is precisely trimmed harmonic distortion over earlier solutions limited by inverting input at +25°C. This trim, along with low shift over temperature and supply linearity. Beyond simple high gain applications, the OPA2683 voltage, gives a very robust design over a wide range of operating CFB amplifier can allow the gain setting element to be set with conditions. Further system power reduction is possible using PLUS considerable freedom from amplifier bandwidth interaction. This the shutdown feature of the MSOP-10 package. NONINVERTING SMALL-SIGNAL FREQUENCY RESPONSE V+ 6 G = 10 G = 1 3 G = 2 + VO dB) 0 n ( –3 ai G = 50 V– Z(S) IERR d G –6 ze G = 10 IERR mali –9 RF Nor –12 G = 50 –15 R R = 953Ω G = 100 G F Low-Power Amplifier –18 1 10 100 200 U.S. Patent No. 6,724,260 Frequency (Hz) Please be aware that an important notice concerning availability, standard warranty, and use in critical applications of Texas Instruments semiconductor products and disclaimers thereto appears at the end of this data sheet. All trademarks are the property of their respective owners. PRODUCTION DATA information is current as of publication date. Copyright © 2002-2009, Texas Instruments Incorporated Products conform to specifications per the terms of Texas Instruments standard warranty. Production processing does not necessarily include testing of all parameters. www.ti.com
ABSOLUTE MAXIMUM RATINGS(1) ELECTROSTATIC Power Supply...............................................................................±6.5V DISCHARGE SENSITIVITY DC Internal Power Dissipation......................................See Thermal Analysis Differential Input Voltage..................................................................±1.2V This integrated circuit can be damaged by ESD. Texas Instru- Input Voltage Range............................................................................±V S ments recommends that all integrated circuits be handled with Storage Temperature Range: ID, IDCN.........................–65°C to +125°C Lead Temperature (soldering, 10s).............................................. +300°C appropriate precautions. Failure to observe proper handling Junction Temperature (T )...........................................................+150°C and installation procedures can cause damage. J ESD Rating: Human Body Model (HBM)........................................2000V ESD damage can range from subtle performance degradation to Charged Device Model (CDM)..................................1000V complete device failure. Precision integrated circuits may be more NOTE: (1) Stresses above those listed under Absolute Maximum Ratings may susceptible to damage because very small parametric changes cause permanent damage to the device. Exposure to absolute maximum could cause the device not to meet its published specifications. conditions for extended periods may affect device reliability. OPA2683 RELATED PRODUCTS SINGLES DUALS TRIPLES QUADS FEATURES OPA684 OPA2684 OPA3684 OPA4684 Low-Power CFB OPA691 OPA2691 OPA3691 — High Slew Rate CFB OPA695 OPA2695 OPA3695 — > 500MHz CFB PACKAGE/ORDERING INFORMATION(1) SPECIFIED PACKAGE TEMPERATURE PACKAGE ORDERING TRANSPORT PRODUCT PACKAGE-LEAD DESIGNATOR RANGE MARKING NUMBER MEDIA, QUANTITY OPA2683 SO-8 D –40°C to +85°C OPA2683 OPA2683ID Rails,100 " " " " " OPA2683IDR Tape and Reel, 2500 OPA2683 SOT23-8 DCN –40°C to +85°C B83 OPA2683IDCNT Tape and Reel, 250 " " " " " OPA2683IDCNR Tape and Reel, 3000 OPA2683 MSOP-10 DGS –40°C to +85°C BUI OPA2683IDGST Tape and Reel, 250 " " " " " OPA2683IDGSR Tape and Reel, 2500 NOTE: (1) For the most current package and ordering information, see the Package Option Addendum at the end of this document, or see the TI web site at www.ti.com. PIN CONFIGURATION Top View SO-8 Top View SOT23-8 Out A 1 8 +V S Out A 1 8 +V S –In A 2 7 Out B –In A 2 7 Out B +In A 3 6 –In B +In A 3 6 –In B –V 4 5 +In B S –V 4 5 +In B S Top View MSOP-10 +In A 1 10 –In A B83 DIS A 2 9 Out A –V 3 8 +V S S DIS B 4 7 Out B +In B 5 6 –In B Pin 1 OPA2683 2 www.ti.com SBOS244H
± ELECTRICAL CHARACTERISTICS: V = 5V S ° Boldface limits are tested at +25 C. R = 953Ω, R = 1kΩ, and G = +2 (see Figure 1 for AC performance only), unless otherwise noted. F L OPA2683ID, IDCN, IDGS TYP MIN/MAX OVER TEMPERATURE 0°C to –40°C to MIN/ TEST PARAMETER CONDITIONS +25°C +25°C(1) 70°C(2) +85°C(2) UNITS MAX LEVEL(3) AC PERFORMANCE (see Figure 1) Small-Signal Bandwidth (V = 0.5V ) G = +1, R = 953kΩ 200 MHz typ C O PP F G = +2, R = 953Ω 150 124 121 117 MHz min B F G = +5, R = 953Ω 121 MHz typ C F G = +10, R = 953Ω 94 MHz typ B F G = +20, R = 953Ω 72 MHz typ C F Bandwidth for 0.1dB Gain Flatness G = +2, V = 0.5V , R = 953Ω 37 15 14 14 MHz min B O PP F Peaking at a Gain of +1 R = 953Ω, V = 0.5V 1.8 6.5 7.7 8.0 dB max B F O PP Large-Signal Bandwidth G = +2, V = 4V 63 MHz typ C O PP Slew Rate G = –1, V = 4V Step (see Figure 2) 540 450 450 430 V/µs min B O G = +2, V = 4V Step 400 345 338 336 V/µs min B O Rise-and-Fall Time G = +2, V = 0.5V Step 4.6 ns typ C O G = +2, V = 4V Step 7.8 ns typ C O Harmonic Distortion G = +2, f = 5MHz, V = 2V O PP 2nd-Harmonic R = 100Ω –63 –54 –54 –54 dBc max B L R ≥ 1kΩ –71 –55 –55 –55 dBc max B L 3rd-Harmonic R = 100Ω –67 –62 –62 –62 dBc max B L R ≥ 1kΩ –77 –67 –66 –66 dBc max B L Input Voltage Noise f > 1MHz 4.4 5.0 5.5 5.8 nV/√Hz max B Noninverting Input Current Noise f > 1MHz 5.1 5.8 6.4 6.7 pA/√Hz max B Inverting Input Current Noise f > 1MHz 11.6 11.9 12.3 12.4 pA/√Hz max B Differential Gain G = +2, NTSC, V = 1.4V , R = 150Ω 0.13 % typ C O P L Differential Phase G = +2, NTSC, V = 1.4V , R = 150Ω 0.06 deg typ C O P L Channel-to-Channel Isolation f = 5MHz 70 dB typ C DC PERFORMANCE(4) Open-Loop Transimpedance Gain (Z ) V = 0V, R = 1kΩ 700 300 270 250 kΩ min A Input Offset Voltage OL O V = L0V ±1.5 ±3.5 ±4.1 ±4.3 mV max A CM Average Offset Voltage Drift V = 0V ±12 ±12 µV/°C max B Noninverting Input Bias Current VCM = 0V ±2.0 ±4.5 ±5.1 ±5.3 µA max A CM Average Noninverting Input Bias Current Drift V = 0V ±15 ±15 nA/°C max B Inverting Input Bias Current VCM = 0V ±3.0 ±10 ±11 ±11.5 µA max A CM Average Inverting Input Bias Current Drift V = 0V ±20 ±20 nA°/C max B CM INPUT Common-Mode Input Range(5) (CMIR) ±3.75 ±3.65 ±3.65 ±3.60 V min A Common-Mode Rejection Ratio (CMRR) V = 0V 60 53 52 52 dB min A CM Noninverting Input Impedance 50 2 kΩ || pF typ C Inverting Input Resistance (R) Open-Loop, DC 5.0 Ω typ C I OUTPUT Voltage Output Swing 1kΩ Load ±4.1 ±4.0 ±4.0 ±3.9 V min A Current Output, Sourcing V = 0 150 120 115 110 mA min A O Current Output, Sinking V = 0 –110 –100 –95 –90 mA min A O Closed-Loop Output Impedance G = +2, f = 100kHz 0.007 Ω typ C DISABLE (Disabled LOW) (MSOP-10 Only) Power-Down Supply Current (+V ) V = 0, Both Channel –200 –300 –340 –360 µA max A S DIS Disable Time V = +1, See Figure 1 60 ms typ C IN Enable Time V = +1, See Figure 1 40 ns typ C IN Off Isolation G = +2, 5MHz 70 dB typ C Output Capacitance in Disable 1.7 pF typ C Turn On Glitch G = +2, R = 150Ω, V = 0 ±70 mV typ C L IN Turn Off Glitch G = +2, R = 150Ω, V = 0 ±20 mV typ C L IN Enable Voltage 3.4 3.5 3.6 3.7 V min A Disable Voltage 1.8 1.7 1.6 1.5 V max A Control Pin Input Bias Current (DIS) V = 0V, Each Channel 80 120 130 135 µA max A DIS POWER SUPPLY Specified Operating Voltage ±5 V typ C Max Operating Voltage Range ±6 ±6 ±6 V max A Min Operating Voltage Range ±2 V typ C Max Quiescent Current V = ±5V, Both Channels 1.88 2.06 2.08 2.10 mA max A S Min Quiescent Current V = ±5V, Both Channels 1.88 1.70 1.6 1.54 mA min A S Power-Supply Rejection Ratio (–PSRR) Input Referred 62 55 54 54 dB typ A TEMPERATURE RANGE Specification: D, DCN, DGS –40 to +85 °C typ C Thermal Resistance, θ Junction-to-Ambient JA D SO-8 125 °C/W typ C DCN SOT23-8 150 °C/W typ C DGS MSOP-10 140 °C/W typ C NOTES: (1) Junction temperature = ambient for +25°C tested specifications. (2) Junction temperature = ambient at low temperature limit: junction temperature = ambient +2°C at high temperature limit for over-temperature tested specifications. (3) Test levels: (A) 100% tested at +25°C. Over-temperature limits by characterization and simulation. (B) Limits set by characterizationand simulation. (C) Typical value only for information. (4) Current is considered positive out-of-node. V is the input common-mode voltage. CM (5) Tested < 3dB below minimum specified CMRR at ± CMIR limits. OPA2683 3 SBOS244H www.ti.com
ELECTRICAL CHARACTERISTICS: V = +5V S ° Boldface limits are tested at +25 C. R = 1.2kΩ, R = 1kΩ, and G = +2 (see Figure 3 for AC performance only), unless otherwise noted. F L OPA2683ID, IDCN, IDGS TYP MIN/MAX OVER TEMPERATURE 0°C to –40°C to MIN/ TEST PARAMETER CONDITIONS +25°C +25°C(1) 70°C(2) +85°C(2) UNITS MAX LEVEL(3) AC PERFORMANCE (see Figure 3) Small-Signal Bandwidth (V = 0.2V ) G = +1, R = 1.2kΩ 145 MHz typ O PP F G = +2, R = 1.2kΩ 119 96 92 90 MHz min B F G = +5, R = 1.2kΩ 95 MHz typ C F G = +10, R = 1.2kΩ 87 MHz typ C F G = +20, R = 1.2kΩ 60 MHz typ C F Bandwidth for 0.1dB Gain Flatness G = +2, V < 0.5V , R = 1.2kΩ 14 9 8 8 MHz min B O PP F Peaking at a Gain of +1 R = 1.2kΩ, V < 0.5V 1 6 8 8 dB max B F O PP Large-Signal Bandwidth G = +2, V = 2V 70 MHz typ C O PP Slew Rate G = +2, V = 2V Step 210 180 175 170 V/µs min B O Rise-and-Fall Time G = +2, V = 0.5V Step 5.9 ns typ C O G = +2, V = 2V Step 7.8 ns typ C O Harmonic Distortion G = 2, f = 5MHz, V = 2V O PP 2nd-Harmonic R = 100Ω to V /2 –60 –54 –53 –53 dBc max B L S R ≥ 1kΩ to V /2 –66 –55 –55 –55 dBc max B L S 3rd-Harmonic R = 100Ω to V /2 –59 –58 –58 –58 dBc max B L S R ≥ 1kΩ to V /2 –74 –57 –56 –56 dBc max B L S Input Voltage Noise f > 1MHz 4.4 5.0 5.5 5.8 nV/√Hz max B Noninverting Input Current Noise f > 1MHz 5.1 5.8 6.4 6.7 pA/√Hz max B Inverting Input Current Noise f > 1MHz 11.6 11.9 12.3 12.4 pA/√Hz max B Differential Gain G = +2, NTSC, V = 1.4V , R = 150Ω 0.24 % typ C O P L Differential Phase G = +2, NTSC, V = 1.4V , R = 150Ω 0.19 deg typ C O P L Channel-to-Channel Crosstalk f = 5MHz 70 dB type C DC PERFORMANCE(4) Open-Loop Transimpedance Gain (Z ) V = V /2, R = 1kΩ to V /2 700 300 270 250 kΩ min A Input Offset Voltage OL O SV L= V /2 S ±1.0 ±3.0 ±3.6 ±3.8 mV max A CM S Average Offset Voltage Drift V = V /2 ±12 ±12 µV/°C max B Noninverting Input Bias Current VCM = VS/2 ±2 ±4.5 ±5.1 ±5.3 µA max A CM S Average Noninverting Input Bias Current Drift V = V /2 ±12 ±12 nA/°C max B Inverting Input Bias Current VCM = VS/2 ±3 ±8 ±8.7 ±8.9 µA max A CM S Average Inverting Input Bias Current Drift V = V /2 ±15 ±15 nA°/C max B CM S INPUT Least Positive Input Voltage(5) 1.1 1.25 1.29 1.34 V max A Most Positive Input Voltage(5) 3.9 3.75 3.73 3.67 V min A Common-Mode Rejection Ratio (CMRR) V = V /2 56 51 50 50 dB min A CM S Noninverting Input Impedance 50 2 kΩ || pF typ C Inverting Input Resistance (R) Open-Loop, DC 5.6 Ω typ C I OUTPUT Most Positive Output Voltage R = 1kΩ to V /2 4.2 4.1 4.1 4.0 V min A L S Least Positive Output Voltage R = 1kΩ to V /2 0.8 0.9 0.9 1.0 V max A L S Current Output, Sourcing V = V /2 80 65 63 58 mA min A O S Current Output, Sinking V = V /2 –70 –52 –50 –45 mA min A O S Closed-Loop Output Impedance G = +2, f = 100kHz 0.009 Ω typ C DISABLE (Disabled LOW) (MSOP-10 Only) Power-Down Supply Current (+V ) V = 0, Both Channels –200 µA typ C S DIS Off Isolation G = +2, 5MHz 70 dB typ C Output Capacitance in Disable 1.7 pF typ C Turn On Glitch G = +2, R = 150Ω, V = V /2 ±70 mV typ C L IN S Turn Off Glitch G = +2, R = 150Ω, V = V /2 ±20 mV typ C L IN S Enable Voltage 3.4 3.5 3.6 3.7 V min A Disable Voltage 1.8 1.7 1.6 1.5 V max A Control Pin Input Bias Current (DIS) V = 0V, Each Channel 80 120 130 135 µA max A DIS POWER SUPPLY Specified Single-Supply Operating Voltage +5 V typ C Max Single-Supply Operating Voltage +12 +12 +12 V max A Min Single-Supply Operating Voltage +4 V typ C Max Quiescent Current V = +5V, Both Channels 1.58 1.76 1.76 1.76 mA max A S Min Quiescent Current V = +5V, Both Channels 1.58 1.36 1.32 1.28 mA min A S Power-Supply Rejection Ratio (+PSRR) Input Referred 65 dB typ C TEMPERATURE RANGE Specification: D, DCN, DGS –40 to +85 °C typ C Thermal Resistance, θ Junction-to-Ambient JA D SO-8 125 °C/W typ C DCN SOT23-8 150 °C/W typ C DGS MSOP-10 140 °C/W typ C NOTES:(1) Junction temperature = ambient for +25°C tested specifications. (2) Junction temperature = ambient at low temperature limit: junction temperature = ambient +2°C at high temperature limit for over-temperature tested specifications. (3) Test levels: (A) 100% tested at +25°C. Over-temperature limits by characterization and simulation. (B) Limits set by characterization and simulation. (C) Typical value only for information. (4) Current is considered positive out-of-node. V is the input common-mode voltage. CM (5) Tested < 3dB below minimum specified CMRR at ± CMIR limits. OPA2683 4 www.ti.com SBOS244H
± TYPICAL CHARACTERISTICS: V = 5V S T = +25°C, G = +2, R = 953Ω, and R = 1kΩ, unless otherwise noted. A F L NONINVERTING SMALL-SIGNAL INVERTING SMALL-SIGNAL FREQUENCY RESPONSE FREQUENCY RESPONSE 6 6 G = 10 G = 1 VO = 0.5VPP 3 3 R = 953Ω F G = 2 G = –1 Gain (dB) –30 G = 50 Gain (dB) –03 G = –2 malized ––69 G = 10 malized ––69 Nor –12 G = 50 Nor –12 G = –10 G = –5 –15 –15 See Figure 1 G = 100 See Figure 2 G = –20 –18 –18 1 10 100 200 1 10 100 200 Frequency (MHz) Frequency (MHz) NONINVERTING LARGE-SIGNAL INVERTING LARGE-SIGNAL FREQUENCY RESPONSE FREQUENCY RESPONSE 9 3 RGF = = + 9253Ω GRF = = – 9253Ω 1VPP 0.5VPP 0 B) 6 B) 0.5VPP d d n ( n ( ai ai –3 G G ed 3 ed 2VPP z z mali 1VPP mali –6 5V or or PP N 0 N 2V –9 PP See Figure 1 5V See Figure 2 PP –3 –12 1 10 100 200 1 10 100 200 Frequency (MHz) Frequency (MHz) NONINVERTING PULSE RESPONSE INVERTING PULSE RESPONSE 0.8 3.2 0.8 3.2 G = +2 G = –1 0.6 2.4 0.6 2.4 v) v) v) v) V/di 0.4 Large-Signal Right Scale 1.6 V/di V/di 0.4 1.6 V/di m m m m 00 0.2 0.8 00 00 0.2 0.8 00 ge (2 0 Small-Signal Left Scale 0 ge (8 ge (2 0 0 ge (8 Volta –0.2 –0.8 Volta Volta –0.2 Small-Signal Left Scale –0.8 Volta utput –0.4 –1.6 utput utput –0.4 Large-Signal Right Scale –1.6 utput O O O O –0.6 –2.4 –0.6 –2.4 See Figure 1 See Figure 2 –0.8 –3.2 –0.8 –3.2 Time (10ns/div) Time (10ns/div) OPA2683 5 SBOS244H www.ti.com
± TYPICAL CHARACTERISTICS: V = 5V (Cont.) S T = +25°C, G = +2, R = 953Ω, and R = 1kΩ, unless otherwise noted. A F L HARMONIC DISTORTION vs LOAD RESISTANCE HARMONIC DISTORTION vs FREQUENCY –50 –50 –55 VfO = = 5 2MVHPzP –55 VRO == 12kVΩPP L Bc) –60 G = +2 dB) –60 monic Distortion (d –––677505 2nd-Harmonic malized Distortion ( ––––67785050 2nd-Harmonic Har –80 3rd-Harmonic Nor –85 –85 –90 See Figure 1 See Figure 1 3rd-Harmonic –90 –95 100 1k 0.1 1 10 20 Load Resistance (Ω) Frequency (MHz) HARMONIC DISTORTION vs OUTPUT VOLTAGE 5MHz HARMONIC DISTORTION vs SUPPLY VOLTAGE –50 –50 f= 5MHz R L = 1kΩ –55 VRO == 12kVΩPP Bc) –60 Bc) L d d –60 n ( n ( o o orti orti –65 nic Dist –70 2nd-Harmonic nic Dist –70 2nd-Harmonic o o m m –75 Har –80 Har 3rd-Harmonic –80 See Figure 1 3rd-Harmonic See Figure 1 –90 –85 0.1 1 5 2.5 3.0 3.5 4.0 4.5 5.0 5.5 6.0 Output Voltage (VPP) Supply Voltage (±V) HARMONIC DISTORTION vs NONINVERTING GAIN HARMONIC DISTORTION vs INVERTING GAIN –50 –50 Bc) –60 VROL == 12kVΩPP Bc) ––5650 VROL == 12kVΩPP d d on ( 2nd-Harmonic on ( –65 orti orti 2nd-Harmonic st –70 st –70 Di Di nic nic –75 mo 3rd-Harmonic mo 3rd-Harmonic ar –80 ar –80 H H –85 See Figure 1 See Figure 2 –90 –90 1 10 20 1 10 20 Gain (V/V) Gain |(–V/V)| OPA2683 6 www.ti.com SBOS244H
± TYPICAL CHARACTERISTICS: V = 5V (Cont.) S T = +25°C, G = +2, R = 953Ω, and R = 1kΩ, unless otherwise noted. A F L 2-TONE, 3RD-ORDER INPUT VOLTAGE AND CURRENT NOISE DENSITY INTERMODULATION DISTORTION 100 –45 f = 20MHz O –50 Inverting Current Noise Bc) +5V √Noise (nV/Hz)√Noise (pA/Hz) 10 11.6pA/√Hz Noninver5t.in2gp AC/√uHrreznt Noise purious Level (d ––––56675050 PI 50Ω95O3P–Ω9A552V638Ω3 1kΩPO ffO = = 1 50MMHHzz Voltage Current Order S ––7850 O Voltage Noise d- f = 1MHz 4.4nV/√Hz 3r –85 O 1 –90 100 1k 10k 100k 1M 10M 0.1 1 2 Frequency (Hz) V at 1kΩ Load (Each tone) PP R vs C SMALL-SIGNAL BANDWIDTH vs C S LOAD LOAD 50 9 45 0.5dB Peaking RS Adjusted to CLOAD 22pF 10pF 40 6 c) 35 B d ΩR ()S 322050 alized Gain ( 30 VI 50Ω OP+A52V683 RS CL VO1kΩ 10407ppFF 15 Norm –955V3Ω 10 –3 953Ω 5 0 –6 1 10 100 100k 1M 10M 100M 1G C (pF) Frequency (Hz) LOAD CMRR AND PSRR vs FREQUENCY OPEN-LOOP TRANSIMPEDANCE GAIN AND PHASE n-Mode Rejection Ratio (dB)Supply Rejection Ratio (dB) 765432000000 +CPMSRRRR –PSRR Ωp Transimpedance Gain (dB) 112086400000 ∠ ZOL 20log (ZOL) 0––––369100020°Open-Loop Phase () CommoPower- 10 pen-Loo 20 –150 0 O 0 –180 100 1k 10k 100k 1M 10M 100M 10k 100k 1M 10M 100M 1G Frequency (Hz) Frequency (Hz) OPA2683 7 SBOS244H www.ti.com
± TYPICAL CHARACTERISTICS: V = 5V (Cont.) S T = +25°C, G = +2, R = 953Ω, and R = 1kΩ, unless otherwise noted. A F L COMPOSITE VIDEO DIFFERENTIAL GAIN/PHASE OUTPUT CURRENT AND VOLTAGE LIMITATIONS 0.20 5 1W Power Gain = +2 4 Limit ntial Gain (%)°ntial Phase () 00..1150 NTSC, PodsiGtive Video V (V)O –13210 R = 5Ω00L R =L 100ΩR L= 50Ω ee DifferDiffer 0.05 –2 –3 dP –4 Each Channel 1W Power 0 –5 Limit 1 2 3 4 –150 –100 –50 0 50 100 150 Number of 150Ω Video Loads I (mA) O SUPPLY AND OUTPUT CURRENT TYPICAL DC DRIFT OVER TEMPERATURE vs TEMPERATURE 4 200 2.0 Sourcing Output Current 3 µA)mV) 2 A) 175 1.9 A) Input Bias Currents (and Offset Voltage ( ––1210 Noninverting Input Bias Current Input Offset Voltage Output Current (m 115205 SRuigphptl yS CcaulrerentSinking Output Current 11..87 Supply Current (m –3 Inverting Input Bias Current –4 100 1.6 –50 –25 0 25 50 75 100 125 –25 0 25 50 75 100 125 Ambient Temperature (°C) Ambient Temperature (°C) SETTLING TIME CLOSED-LOOP OUTPUT IMPEDANCE vs FREQUENCY 0.05 100 2V Step 0.04 See Figure 1 1/2 % Error to Final Value ––00000.....00000032112 ΩOutput Impedance () 0.10011 95O3PΩA925638Ω3 ZO –0.03 –0.04 –0.05 0.001 0 10 20 30 40 50 60 100 1k 10k 100k 1M 10M 100M Time (ns) Frequency (Hz) OPA2683 8 www.ti.com SBOS244H
± TYPICAL CHARACTERISTICS: V = 5V (Cont.) S T = +25°C, G = +2, R = 953Ω, and R = 1kΩ, unless otherwise noted. A F L NONINVERTING OVERDRIVE RECOVERY INVERTING OVERDRIVE RECOVERY 4.0 8.0 8.0 8.0 3.2 6.4 6.4 6.4 Input Voltage (0.8V/div) –––210012......4680864 ORutipguhtt VSoclatalege See Figure 1 4310–––...134826...628 Output Voltage (1.6V/div) Input Voltage (1.6V/div) –––431134......8260628 ORutipguhtt VSoclatalege 4310–––...134826...628 Input Voltage (1.6V/div) Input Voltage Input Voltage –3.2 Left Scale –6.4 –6.4 Left Scale –6.4 See Figure 2 –4.0 –8.0 –8.0 –8.0 Time (100ns/div) Time (100ns/div) INPUT AND OUTPUT RANGE vs SUPPLY VOLTAGE CHANNEL-TO-CHANNEL CROSSTALK 6 0 5 Input Referred e –10 ng 4 Ra 3 Bc) –20 e d ag 2 n ( –30 ut Volt 10 VIonltpaugte VOoulttapguet stortio –40 d Outp ––12 Range Range onic Di ––5600 n m put a ––34 Har –70 n I –5 –80 –6 –90 ± 2 ± 3 ± 4 ± 5 ± 6 1M 10M 100M ± Supply Voltage Frequency (Hz) DISABLE SUPPLY CURRENT vs TEMPERATURE DISABLE TIME 290 6 Both Channels A) 270 5 VDIS µ ble Supply Current ( 222153190000 V and V (V)OUTDIS 432 VOUT SVeIeN F=i g1uVrDeC 1 a s Di 170 1 150 0 50 25 0 25 50 75 100 125 0 10 20 30 40 50 60 70 80 90 100 Ambient Temperature (°C) Time (ms) OPA2683 9 SBOS244H www.ti.com
± TYPICAL CHARACTERISTICS: V = 5V (Cont.) S T = +25°C, G = +2, R = 953Ω, and R = 1kΩ, unless otherwise noted. A F L DISABLED FEEDTHRU –40 G = +2 Each Channel V = 0V DIS –50 B) –60 d u ( hr –70 dt e e F –80 –90 See Figure 1 –100 0.1 1 10 100 Frequency (MHz) OPA2683 10 www.ti.com SBOS244H
TYPICAL CHARACTERISTICS: V = +5V S T = +25°C, V = 5V, G = +2, R = 1.2kΩ, and R = 1kΩ, unless otherwise noted. A S F L NONINVERTING SMALL-SIGNAL INVERTING SMALL-SIGNAL FREQUENCY RESPONSE FREQUENCY RESPONSE 6 6 G = 2 3 3 G = 1 B) 0 B) 0 n (d –3 G = 5 n (d –3 G = –1 Gai G = 10 Gai d –6 d –6 alize –9 G = 20 alize –9 G = –5 orm G = 50 orm G = –10 N –12 N –12 G = –20 –15 –15 See Figure 3 G = 100 See Figure 4 G = –2 –18 –18 1 10 100 200 1 10 100 200 Frequency (MHz) Frequency (MHz) NONINVERTING LARGE-SIGNAL INVERTING LARGE-SIGNAL FREQUENCY RESPONSE FREQUENCY RESPONSE 9 3 0.2V 0.2V PP PP 0.5V PP 0 6 1V PP Gain (dB) 3 1VP2PVPP Gain (dB) ––36 0.52VVPPPP 0 –9 See Figure 3 See Figure 4 –3 –12 1 10 100 200 1 10 100 200 Frequency (MHz) Frequency (MHz) NONINVERTING PULSE RESPONSE INVERTING PULSE RESPONSE 0.4 1.6 0.4 1.6 0.3 Large-Signal Right Scale 1.2 0.3 1.2 v) v) v) v) V/di 0.2 0.8 V/di V/di 0.2 0.8 V/di m m m m 00 0.1 0.4 00 00 0.1 0.4 00 ge (1 0 Small-Signal Left Scale 0 ge (4 ge (1 0 0 ge (4 a a a Small-Signal Left Scale a Volt –0.1 –0.4 Volt Volt –0.1 –0.4 Volt utput –0.2 –0.8 utput utput –0.2 Large-Signal Right Scale –0.8 utput O O O O –0.3 –1.2 –0.3 –1.2 See Figure 3 See Figure 4 –0.4 –1.6 –0.4 –1.6 Time (10ns/div) Time (10ns/div) OPA2683 11 SBOS244H www.ti.com
TYPICAL CHARACTERISTICS: V = +5V (Cont.) S T = +25°C, V = 5V, G = +2, R = 1.2kΩ, and R = 1kΩ, unless otherwise noted. A S F L HARMONIC DISTORTION vs LOAD RESISTANCE HARMONIC DISTORTION vs FREQUENCY –50 –50 f = 5MHz V = 2V O PP –55 V = 2V R = 1kΩ O PP L Bc) –60 2nd-Harmonic Bc) –60 Distortion (d ––6750 3rd-Harmonic Distortion (d –70 2nd-Harmonic monic –75 monic 3rd-Harmonic Har –80 Har –80 –85 See Figure 3 See Figure 3 –90 –90 100 1k 0.1 1 10 20 Load Resistance (Ω) Frequency (MHz) 2-TONE, 3RD-ORDER HARMONIC DISTORTION vs OUTPUT VOLTAGE INTERMODULATION DISTORTION –50 –40 –55 c) c) –50 B –60 B d d 20MHz ortion ( –65 ortion ( –60 st –70 st Di Di 10MHz onic –75 3rd-Harmonic onic –70 m m ar –80 ar 5MHz H H –80 2nd-Harmonic –85 See Figure 3 See Figure 3 –90 –90 0.1 1 3 0.1 1 Output Voltage (VPP) VPP at 1kΩ Load (each tone) SUPPLY AND OUTPUT CURRENT vs TEMPERATURE COMPOSITE VIDEO DIFFERENTIAL GAIN/PHASE 100 1.9 0.30 G = +2 NTSC, Positive Video 0.25 90 1.8 Output Current (mA) 8700 SinkSiLnoeguf rtO cSiunctgpa ulLOete uCftt puSurcrtea CnleturreSnutRppiglyh tC Sucrarelent 11..76 Supply Current (mA) Differential Gain (%)°Differential Phase () 000...211050 ddPG 60 1.5 0.05 50 1.4 0 –50 –25 0 25 50 75 100 125 1 2 3 4 Ambient Temperature (°C) Number of 150Ω Video Loads OPA2683 12 www.ti.com SBOS244H
APPLICATIONS INFORMATION Figure 2 shows the DC-coupled, gain of –1V/V, dual power- supply circuit used as the basis of the inverting Typical LOW-POWER, CURRENT-FEEDBACK OPERATION Characteristics for each channel. Inverting operation offers The dual channel OPA2683 gives a new level of perfor- several performance benefits. Since there is no common- mance in low-power, current-feedback op amps. Using a mode signal across the input stage, the slew rate for inverting new input stage buffer architecture, the OPA2683 CFB operation is typically higher and the distortion performance is PLUS amplifier holds nearly constant AC performance over a wide slightly improved. An additional input resistor, R , is included M gain range. This closed-loop internal buffer gives a very low in Figure 2 to set the input impedance equal to 50Ω. The and linearized impedance at the inverting node, isolating the parallel combination of R and R set the input impedance. M G amplifier’s AC performance from gain element variations. As the desired gain increases for the inverting configuration, This low impedance allows both the bandwidth and distortion R is adjusted to achieve the desired gain, while R is also G M to remain nearly constant over gain, moving closer to the adjusted to hold a 50Ω input match. A point will be reached ideal current- feedback performance of gain bandwidth inde- where R will equal 50Ω, R is removed, and the input match G M pendence. This low-power amplifier also delivers exceptional is set by R only. With R fixed to achieve an input match to G G output power—its ±4V swing on ±5V supplies with > 100mA 50Ω, increasing R will increase the gain. However, this will F output drive gives excellent performance into standard video reduce the achievable bandwidth as the feedback resistor loads or doubly-terminated 50Ω cables. This dual-channel increases from its recommended value of 953Ω. If the source device can provide adequate drive for several emerging does not require an input match to 50Ω, either adjust R to M differential driver applications with exceptional power effi- get the desired load, or remove it and let the R resistor G ciency. Single +5V supply operation is also supported with alone provide the input load. similar bandwidths but reduced output power capability. For higher output power in a dual current-feedback op amp, consider the OPA2684, OPA2691, or OPA2677. +5V Figure 1 shows the DC-coupled, gain of +2, dual power- supply circuit used as the basis of the ±5V Electrical and + 0.1µF 6.8µF Typical Characteristics for each channel. For test purposes, the input impedance is set to 50Ω with a resistor to ground, and the output impedance is set to a 1kΩ load. Voltage swings reported in the characteristics are taken directly at the 1/2 OPA2683 VO input and output pins. For the circuit of Figure 1, the total effective load will be 1kΩ || 1.9kΩ = 656Ω. Gain changes are 1kΩ most easily accomplished by simply resetting the RG value, 50Ω Source RG RF holding R constant at its recommended value of 953Ω. 953Ω 953Ω F V I R M 52.3Ω 0.1µF 6.8µF + +5V –5V FIGURE 2. DC-Coupled, G = –1V/V, Bipolar Supply Specifi- 0.1µF +6.8µF cations and Test Circuit. V These circuits show ±5V operation. The same circuit can be I 50Ω Source RM 1/2 applied with bipolar supplies from ±2.5V to ±6V. Internal 50Ω OPA2683 VO supply independent biasing gives nearly the same perfor- mance for the OPA2683 over this wide range of supplies. 1kΩ Generally, the optimum feedback resistor value (for nomi- R F nally flat frequency response at G = +2) will increase in value 953Ω as the total supply voltage across the OPA2683 is reduced from ±5V. R G 953Ω 0.1µF 6.8µF See Figure 3 for the AC-coupled, single +5V supply, gain of + +2V/V circuit configuration used as a basis only for the +5V –5V Electrical and Typical Characteristics for each channel. The key requirement of broadband single-supply operation is to maintain input and output signal swings within the usable voltage ranges at both the input and the output. The circuit FIGURE 1. DC-Coupled, G = +2V/V, Bipolar Supply Speci- of Figure 3 establishes an input midpoint bias using a simple fications and Test Circuit. resistive divider from the +5V supply (two 10kΩ resistors) to the noninverting input. The input signal is then AC-coupled OPA2683 13 SBOS244H www.ti.com
into this midpoint voltage bias. The input voltage can swing a current-feedback amplifier, wideband operation is retained to within 1.25V of either supply pin, giving a 2.5V input even under this condition. PP signal range centered between the supply pins. The input The circuits of Figure 3 and 4 show single-supply operation impedance of Figure 3 is set to give a 50Ω input match. If the at +5V. These same circuits may be used up to single source does not require a 50Ω match, remove this and drive supplies of +12V with minimal change in the performance of directly into the blocking capacitor. The source will then see the OPA2683. the 5kΩ load of the biasing network. The gain resistor (R ) G is AC-coupled, giving the circuit a DC gain of +1, which puts the noninverting input DC bias voltage (2.5V) on the output +5V as well. The feedback resistor value has been adjusted from the bipolar ±5V supply condition to re-optimize for a flat + 0.1µF 6.8µF frequency response in +5V only, gain of +2, operation. On a 10kΩ single +5V supply, the output voltage can swing to within 0.9V of either supply pin while delivering more than 70mA 0.1µF output current, giving 3.2V output swing into 100Ω (8dBm 1/2 maximum at a matched 50Ω load). The circuit of Figure 3 0.1µF 10kΩ OPA2683 VO shows a blocking capacitor driving into a 1kΩ load. Alterna- 1kΩ tively, the blocking capacitor could be removed if the load is tied to a supply midpoint or to ground if the DC current 50Ω Source 0.1µF1.R2kGΩ 1.R2kFΩ V required by the load is acceptable. I R M 52.3Ω +5V FIGURE 4. AC-Coupled, G = –1V/V, Single-Supply Specifi- + cations and Test Circuit. 0.1µF 6.8µF 50Ω Source 0.1µF 10kΩ DIFFERENTIAL INTERFACE APPLICATIONS V I 0.1µF R50MΩ 10kΩ OPA1/22683 VO Ddiuffaelr eonpt iaaml opustp aurte a ppaprlitcicautiloanrlsy. sTuyitpaicbalell yto, thdeiffseer efanltli ainl tion peuitht etor 1kΩ Analog-to-Digital Converter (ADC) input interfaces or line driver applications. Two basic approaches to differential I/O R 1.2kFΩ are noninverting or inverting configurations. Since the output is differential, the signal polarity is somewhat meaningless— R the noninverting and inverting terminology applies here to G 1.2kΩ where the input is brought into the OPA2683. Each has its 0.1µF advantages and disadvantages. Figure 5 shows a basic starting point for noninverting differential I/O applications. FIGURE 3. AC-Coupled, G = +2V/V, Single-Supply Specifi- +V CC cations and Test Circuit. Figure 4 shows the AC-coupled, single +5V supply, gain of 1/2 –1V/V circuit configuration used as a basis for the +5V OPA2683 Typical Characteristics for each channel. In this case, the midpoint DC bias on the noninverting input is also decoupled RF with an additional 0.1µF decoupling capacitor. This reduces 953Ω the source impedance at higher frequencies for the noninverting input bias current noise. This 2.5V bias on the VI RG 95R3FΩ VO noninverting input pin appears on the inverting input pin and, since R is DC blocked by the input capacitor, will also G appear at the output pin. One advantage to inverting opera- 1/2 tion is that since there is no signal swing across the input OPA2683 stage, higher slew rates and operation to even lower supply voltages is possible. To retain a 1V output capability, PP operation down to 3V supply is allowed. At +3V supply, the –V CC input stage is saturated, but for the inverting configuration of FIGURE 5. Noninverting Differential I/O Amplifier. OPA2683 14 www.ti.com SBOS244H
This approach provides for a source termination impedance The two noninverting inputs provide an easy common-mode that is independent of the signal gain. For instance, simple control input. This is particularly simple if the source is differential filters may be included in the signal path right up AC-coupled through either blocking caps or a transformer. to the noninverting inputs without interacting with the gain In either case, the common-mode input voltages on the two setting. The differential signal gain for the circuit of Figure 5 is: noninverting inputs again have a gain of 1 to the output pins, giving particularly easy common-mode control for single- A = 1 + 2 • R /R (1) D F G supply operation. The OPA2683 used in this configuration Since the OPA2683 is a CFB amplifier, its bandwidth is does constrain the feedback to the 953Ω region for best PLUS principally controlled with the feedback resistor value; see frequency response. With R fixed, the input resistors may be F Figure 5 for the recommended value of 953Ω. The differential adjusted to the desired gain but will also be changing the gain, however, may be adjusted with considerable freedom input impedance as well. The high-frequency common-mode using just the R resistor. In fact, R may be a reactive gain for this circuit from input to output will be the same as G G network providing a very isolated shaping to the differential for the signal gain. Again, if the source might include an frequency response. Since the inverting inputs of the OPA2683 undesired common-mode signal, that signal could be re- are very low impedance closed-loop buffer outputs, the R jected at the input using blocking caps (for low frequency and G element does not interact with the amplifier’s bandwidth; DC common-mode) or a transformer coupling. wide ranges of resistor values and/or filter elements may be inserted here with minimal amplifier bandwidth interaction. DC-COUPLED SINGLE TO DIFFERENTIAL CONVERSION Various combinations of single-supply or AC-coupled gain The previous differential output circuits were also set up to can also be delivered using the basic circuit of Figure 5. receive a differential input. A simple way to provide a DC- Common-mode bias voltages on the two noninverting inputs coupled single to differential conversion using a dual op amp pass on to the output with a gain of 1 since an equal DC is shown in Figure 7. Here, the output of the first stage is voltage at each inverting node creates no current through simply inverted by the second to provide an inverting version RG. This circuit does show a common-mode gain of 1 from of a single amplifier design. This approach works well for input to output. The source connection should either remove lower frequencies but will start to depart from ideal differential this common-mode signal if undesired (using an input trans- outputs as the propagation delay and distortion of the invert- former can provide this function), or the common-mode ing stage adds significantly to that present at the noninverting voltage at the inputs can be used to set the output common- output pin. mode bias. If the low common-mode rejection of this circuit is a concern, the output interface may also be used to reject that common-mode. For instance, most modern differential +5V input ADCs reject common-mode signals very well, while a line driver application through a transformer will also attenu- 1V PP ate the common-mode signal through to the line. 50Ω 1/2 OPA2683 Figure 6 shows a differential I/O stage configured as an inverting amplifier. In this case, the gain resistors (R ) G 953Ω become part of the input resistance for the source. This provides a better noise performance than the noninverting 191Ω configuration but does limit the flexibility in setting the input impedance separately from the gain. 953Ω 12VPP Differential 953Ω +V CC VCM 1/2 OPA2683 1/2 OPA2683 R F RG 953Ω –5V R FIGURE 7. Single to Differential Conversion. V F V I RG 953Ω O The circuit of Figure 7 is set up for a single-ended gain of 6 1/2 to the output of the first amplifier, then an inverting gain of OPA2683 –1 through the second stage to provide a total differential VCM gain of 12. See Figure 8 for the 75MHz small-signal band- width delivered by the circuit of Figure 7. Large-signal distor- –VCC tion at 12V output at 1MHz into the 1kΩ differential load is PP ≤ –76dBc. FIGURE 6. Inverting Differential I/O Amplifier. OPA2683 15 SBOS244H www.ti.com
of Figure 9 designs the filter for a differential gain of 5 using the OPA2683. The resistor values have been adjusted slightly SINGLE TO DIFFERENTIAL CONVERSION 24 to account for the amplifier bandwidth effects. While this circuit is bipolar, using ±5V supplies, it can easily 21 be adapted to single-supply operation. This is typically done 18 by providing a supply midpoint reference at the noninverting B) 15 inputs, then adding DC blocking caps at each input and in d n ( series with the amplifier gain resistor, RG. This will add two Gai 12 real zeroes in the response, transforming the circuit into a bandpass. Figure 10 shows the frequency response for the 9 filter of Figure 9. 6 3 1 10 100 200 Frequency (MHz) 10MHz, 3RD-ORDER BUTTERWORTH LOW PASS FREQUENCY RESPONSE 14 FIGURE 8. Small-Signal Bandwidth for Figure 7. 11 DIFFERENTIAL ACTIVE FILTER B) n (d 8 The OPA2683 can provide a very capable gain block for low- ai G power active filters. The dual design lends itself very well to al 5 differential active filters. Where the filter topology is looking enti er 2 for a simple gain function to implement the filter, the Diff noninverting configuration is preferred to isolate the filter –1 elements from the gain elements in the design. Figure 9 shows an example of a very low-power, 10MHz, 3rd-order –4 Butterworth low-pass Sallen-Key filter. Often, these filters are 1 10 20 designed at an amplifier gain of 1 to minimize amplifier Frequency (MHz) bandwidth interaction with the desired filter shape. Since the OPA2683 shows minimal bandwidth change with gain, this FIGURE 10. Frequency Response for 10MHz, 3rd-Order feature would not be a constraint in this design. The example Butterworth Low-Pass Filter. 100pF 47Ω 183Ω 20Ω +5V 1/2 OPA2683 953Ω 357Ω 75pF R V G 22pF V I 475Ω O 953Ω 357Ω 1/2 47Ω 183Ω 20Ω OPA2683 100pF –5V FIGURE 9. Low-Power, Differential I/O, 4th-Order Butterworth Active Filter. OPA2683 16 www.ti.com SBOS244H
SINGLE-SUPPLY, HIGH GAIN DIFFERENTIAL +5V ADC DRIVER Where a very low-power differential I/O interface to a moder- V DIS Power-Supply ate performance ADC is required, the circuit of Figure 11 may +5V Decoupling be considered. The circuit builds on the inverting differential Not Shown I/O configuration of Figure 6 by adding the input transformer U1 and the output low-pass filter. The input transformer provides CH0 1/2 78.7Ω a single-to-differential conversion where the input signal is 75Ω OPA2683 VOUT still very low power—it also provides a gain of 2 and removes 75Ω Line any common-mode signal from the inputs. This single +5V design sets a midpoint bias from the supply at each of the 681Ω 953Ω noninverting inputs. +5V CH1 1/2 78.7Ω 75Ω V OPA2683 OUT 10kΩ 75Ω Line VCM 681Ω 953Ω 0.1µF 10kΩ 1/2 OPA2683 ADC 500Ω (Optional) 200Ω 800Ω R +5V S 1:2 50Ω U2 C Source 200Ω 800Ω RS L CH0 1/2 78.7Ω 75Ω OPA2683 15.3dB Noise Figure 1/2 Gain = 8V/V OPA2683 18.1dB V 681Ω 953Ω CM 500Ω (Optional) FIGURE 11. Single-Supply Differential ADC Driver. CH1 1/2 78.7Ω 75Ω OPA2683 This circuit also includes optional 500Ω pull-down resistors at the output. With a 2.5V DC common-mode operating point (set by V ), this will add 5mA to ground in the output stage. 681Ω 953Ω CM This essentially powers up the NPN side of the output stage significantly reducing distortion. It is important for good 2nd- order distortion to connect the grounds of these two resistors at the same point to minimize ground plane current for the FIGURE 12. Frequency Response for 10MHz, 3rd-Order differential output signal. Butterworth Low-Pass Filter. LOW-POWER MUX/LINE DRIVER Since the OPA2683 does not disable quickly, this approach is not suitable for pixel-by-pixel multiplexing—however, it Using the shutdown feature, two OPA2683s can provide an does provide an easy way to switch between two possible easy low-power way to select one of two possible sources for RGB sources. The output swing provided by the active moderate-resolution monitors. Figure 12 shows a recom- channel will divide back through the inactive channel feed- mended circuit where each of the outputs are combined in a back to appear at the inverting input of the OFF channel. To way that provides a net gain of 1 to the matched 75Ω load retain good pulse fidelity, or low distortion, this divided down with a 75Ω output impedance. This brings the two outputs for output signal at the inverting inputs of the OFF channels, plus each color together through a 78.7Ω resistor with a slightly the OFF channel input signals, should not exceed 0.7V . As > 2 gain provided by the amplifiers. When one channel is PP the signal across the buffers of the inactive channels ex- shutdown, the feedback network is still present, slightly ceeds 0.7V , diodes across the inputs may begin to turn on attenuating the signal and combining in parallel with the PP causing a nonlinear load to the active channel. This will 78.7Ω to give a 75Ω source impedance. degrade signal linearity under those conditions. OPA2683 17 SBOS244H www.ti.com
DESIGN-IN TOOLS OPERATING SUGGESTIONS DEMONSTRATION FIXTURES SETTING RESISTOR VALUES TO OPTIMIZE BANDWIDTH Two printed circuit boards (PCBs) are available to assist in Any current-feedback op amp like the OPA2683 can hold the initial evaluation of circuit performance using the OPA2683 high bandwidth over signal-gain settings with the proper in its two package options. Both of these are offered free of adjustment of the external resistor values. A low-power part charge as unpopulated PCBs, delivered with a user’s guide. like the OPA2683 typically shows a larger change in band- The summary information for these fixtures is shown in width due to the significant contribution of the inverting input Table I. impedance to loop-gain changes as the signal gain is changed. Figure 13 shows a simplified analysis circuit for any current- feedback amplifier. ORDERING LITERATURE PRODUCT PACKAGE NUMBER NUMBER OPA2683ID SO-8 DEM-OPA-SO-2A SBOU003 OPA2683IDCN SOT23-8 DEM-OPA-SOT-2A SBOU001 OPA2683IDGS MSOP-10 DEM-OPA-MSOP-2B SBOU040 V I TABLE I. Demonstration Fixtures by Package. α V The demonstration fixtures can be requested at the Texas O Instruments web site (www.ti.com) through the OPA2683 RI Z i (S) ERR product folder. i ERR R F MACROMODELS Computer simulation of circuit performance using SPICE is R often useful when analyzing the performance of analog G circuits and systems. This is particularly true for higher speed designs where parasitic capacitance and inductance can have a major effect on circuit performance. A SPICE model FIGURE 13. Current-Feedback Transfer Function Analysis for the OPA683 is available in the product folder on the TI Circuit. web site (www.ti.com). This is the single channel model for the OPA2683—simply use two of these to implement an The key elements of this current-feedback op amp model are: OPA2683 simulation. These models do a good job of predict- ing small-signal AC and transient performance under a wide α ⇒ Buffer gain from the noninverting input to the inverting input variety of operating conditions. However, they are less accu- R ⇒ Buffer output impedance rate in predicting the harmonic distortion or dG/dP character- I i ⇒ Feedback error current signal istics. These models do not attempt to distinguish between ERR the package types in their small-signal AC performance. Z(s) ⇒ Frequency dependent open-loop transimpedance gain from i to V ERR O OPA2683 18 www.ti.com SBOS244H
The buffer gain is typically very close to 1.00 and is normally frequency response given by Equation 2 will start to roll off, neglected from signal gain considerations. It will, however, set and is exactly analogous to the frequency at which the noise the CMRR for a single op amp differential amplifier configura- gain equals the open-loop voltage gain for a voltage-feed- tion. For the buffer gain α < 1.0, the CMRR = –20 • log(1 – α). back op amp. The difference here is that the total impedance The closed-loop input stage buffer used in the OPA2683 gives in the denominator of Equation 3 may be controlled some- a buffer gain more closely approaching 1.00 and this shows up what separately from the desired signal gain (or NG). in a slightly higher CMRR than previous current-feedback op The OPA2683 is internally compensated to give a maximally amps. flat frequency response for R = 953Ω at NG = 2 on ±5V F R, the buffer output impedance, is a critical portion of the supplies. That optimum value goes to 1.2kΩ on a single +5V I bandwidth control equation. The OPA2683 reduces this supply. Normally, with a current-feedback amplifier, it is element to approximately 5.0Ω using the loop gain of the possible to adjust the feedback resistor to hold this band- closed-loop input buffer stage. This significant reduction in width up as the gain is increased. The CFB architecture PLUS output impedance, on very low power, contributes signifi- has reduced the contribution of the inverting input impedance cantly to extending the bandwidth at higher gains. to provide exceptional bandwidth to higher gains without A current-feedback op amp senses an error current in the adjusting the feedback resistor value. The Typical Character- inverting node (as opposed to a differential input error volt- istics show the small-signal bandwidth over gain with a fixed age for a voltage-feedback op amp) and passes this on to feedback resistor. the output through an internal frequency dependent Putting a closed-loop buffer between the noninverting and transimpedance gain. The Typical Characteristics show this inverting inputs does bring some added considerations. Since open-loop transimpedance response. This is analogous to the voltage at the inverting output node is now the output of the open-loop voltage gain curve for a voltage-feedback op a locally closed-loop buffer, parasitic external capacitance on amp. Developing the transfer function for the circuit of Figure this node can cause frequency response peaking for the 13 gives Equation 2: transfer function from the noninverting input voltage to the inverting node voltage. While it is always important to keep R the inverting node capacitance low for any current-feedback α1+ F VO = RG = αNG op amp, it is critically important for the OPA2683. External VI 1+RF +RI 1+RRGF 1+RF +Z(RSI)NG lftarheyeqonuu ietn ncccraeyp arasecisnitpgao ntnchseee .fi enTe hedixbsc apeceskas r keoinsf gis2 tcpoaFr n v wablieull ees—atasbriltuy t t oriet dpisue cpaerked ft ehbrey- Z (S) able, from a noise and dynamic range standpoint, to keep R that capacitance low, allowing a close to nominal 953Ω NG=1+RGF (2) feedback resistor for flat frequency response. Very high parasitic capacitance values on the inverting node (> 5pF) can possibly cause input stage oscillation that cannot be This is written in a loop-gain analysis format where the errors filtered by a feedback element adjustment. arising from a non-infinite open-loop gain are shown in the An added consideration is that at very high gains, 2nd-order denominator. If Z were infinite over all frequencies, the (S) effects in the inverting output impedance cause the overall denominator of Equation 2 would reduce to 1 and the ideal response to peak up. If desired, it is possible to retain a flat desired signal gain shown in the numerator would be achieved. frequency response at higher gains by adjusting the feed- The fraction in the denominator of Equation 2 determines the back resistor to higher values as the gain is increased. Since frequency response. Equation 3 shows this as the loop-gain the exact value of feedback that will give a flat frequency equation. response at high gains depends strongly in inverting and Z R +(RS)NG =LoopGain (3) output node parasitic capacitance values, it is best to experi- F I ment in the specific board with increasing values until the desired flatness (or pulse response shape) is obtained. In If 20 • log(R + NG • R) were drawn on top of the open-loop F I general, increasing R (and then adjusting R to the desired transimpedance plot, the difference between the two would F G gain) will move towards flattening the response, while de- be the loop gain at a given frequency. Eventually, Z rolls off (S) creasing it will extend the bandwidth at the cost of some to equal the denominator of Equation 3, at which point the peaking. The OPA683 data sheet gives an example of this loop gain has reduced to 1 (and the curves have intersected). optimization of R versus gain. This point of equality is where the amplifier’s closed-loop F OPA2683 19 SBOS244H www.ti.com
OUTPUT CURRENT AND VOLTAGE DRIVING CAPACITIVE LOADS The OPA2683 provides output voltage and current capabili- One of the most demanding and yet very common load ties that can support the needs of driving doubly-terminated conditions for an op amp is capacitive loading. Often, the 50Ω lines. If the 1kΩ load of Figure 1 is changed to a 100Ω capacitive load is the input of an ADC, including additional load, the total load is the parallel combination of the 100Ω external capacitance which may be recommended to im- load, and the 1.9kΩ total feedback network impedance. This prove ADC linearity. A high-speed, high open-loop gain 95Ω load will require no more than 42mA output current to amplifier like the OPA2683 can be very susceptible to de- support the ±4.0V minimum output voltage swing specified creased stability and closed-loop response peaking when a for 1kΩ loads. This is well below the specified minimum capacitive load is placed directly on the output pin. When the +120/–90mA specifications over the full temperature range. amplifier’s open-loop output resistance is considered, this capacitive load introduces an additional pole in the signal The specifications described above, though familiar in the path that can decrease the phase margin. Several external industry, consider voltage and current limits separately. In solutions to this problem have been suggested. When the many applications, it is the voltage • current, or V-I product, primary considerations are frequency response flatness, pulse which is more relevant to circuit operation. Refer to the response fidelity, and/or distortion, the simplest and most Output Voltage and Current Limitations plot in the Typical effective solution is to isolate the capacitive load from the Characteristics. The X- and Y-axes of this graph show the feedback loop by inserting a series isolation resistor between zero-voltage output current limit and the zero-current output the amplifier output and the capacitive load. This does not voltage limit, respectively. The four quadrants give a more eliminate the pole from the loop response, but rather shifts it detailed view of the OPA2683’s output drive capabilities. and adds a zero at a higher frequency. The additional zero Superimposing resistor load lines onto the plot shows the acts to cancel the phase lag from the capacitive load pole, available output voltage and current for specific loads. thus increasing the phase margin and improving stability. The minimum specified output voltage and current over temperature are set by worst-case simulations at the cold The Typical Characteristics show the recommended RS vs temperature extreme. Only at cold startup will the output CLOAD and the resulting frequency response at the load. The current and voltage decrease to the numbers shown in the 1kΩ resistor shown in parallel with the load capacitor is a electrical characteristic tables. As the output transistors de- measurement path and may be omitted. The required series liver power, their junction temperatures will increase, de- resistor value may be reduced by increasing the feedback creasing their V s (increasing the available output voltage resistor value from its nominal recommended value. This will BE increase the phase margin for the loop gain, allowing a lower swing) and increasing their current gains (increasing the series resistor to be effective in reducing the peaking due to available output current). In steady-state operation, the avail- capacitive load. SPICE simulation can be effectively used to able output voltage and current will always be greater than optimize this approach. Parasitic capacitive loads greater that shown in the over-temperature specifications since the than 5pF can begin to degrade the performance of the output stage junction temperatures will be higher than the OPA2683. Long PC board traces, unmatched cables, and minimum specified operating ambient. connections to multiple devices can easily cause this value To maintain maximum output stage linearity, no output short- to be exceeded. Always consider this effect carefully, and circuit protection is provided. This will not normally be a add the recommended series resistor as close as possible to problem, since most applications include a series matching the OPA2683 output pin (see Board Layout Guidelines). resistor at the output that will limit the internal power dissipa- tion if the output side of this resistor is shorted to ground. However, shorting the output pin directly to the adjacent positive power-supply pin can destroy the amplifier. If addi- tional short-circuit protection is required, consider a small series resistor in the power-supply leads. This resistor will, under heavy output loads, reduce the available output volt- age swing. A 5Ω series resistor in each power-supply lead will limit the internal power dissipation to less than 1W for an output short-circuit, while decreasing the available output voltage swing only 0.25V for up to 50mA desired load currents. Always place the 0.1µF power-supply decoupling capacitors after these supply current limiting resistors directly on the supply pins. OPA2683 20 www.ti.com SBOS244H
DISTORTION PERFORMANCE The OPA2683 has an extremely low 3rd-order harmonic distortion, particularly for light loads and at lower frequen- The OPA2683 provides very low distortion in a low-power cies. This also gives low 2-tone, 3rd-order intermodulation part. The CFB architecture also gives two significant PLUS distortion as shown in the Typical Characteristics. Since the areas of distortion improvement. First, in operating regions OPA2683 includes internal power boost circuits to retain where the 2nd-harmonic distortion due to output stage good full-power performance at high frequencies and out- nonlinearities is very low (frequencies < 1MHz, low output puts, it does not show a classical 2-tone, 3rd-order inter- swings into light loads) the linearization at the inverting node modulation intercept characteristic. Instead, it holds relatively provided by the CFB design gives 2nd-harmonic distor- PLUS low and constant 3rd-order intermodulation spurious levels tions that extend into the –90dBc region. Previous current- over power. The Typical Characteristics show this spurious feedback amplifiers have been limited to approximately level as a dBc below the carrier at fixed center frequencies –85dBc due to the nonlinearities at the inverting input. The swept over single-tone power at a matched 50Ω load. These second area of distortion improvement comes in a distortion spurious levels drop significantly (> 12dB) for lighter loads performance that is largely gain independent. To the extent than the 100Ω used in that plot. Converter inputs, for in- that the distortion at a specific output power is output stage stance, will see ≤ 82dBc 3rd-order spurious to 10MHz for full- dependent, 3rd-harmonics particularly, and to a lesser ex- scale inputs. For even lower 3rd-order intermodulation distor- tend 2nd-harmonic distortion, remains constant as the gain tion to much higher frequencies, consider the OPA2691. increases. This is due to the constant loop gain versus signal gain provided by the CFB design. As shown in the PLUS Typical Characteristics, while the 3rd-harmonic is constant NOISE PERFORMANCE with gain, the 2nd-harmonic degrades at higher gains. This Wideband current-feedback op amps generally have a higher is largely due to board parasitic issues. Slightly imbalanced output noise than comparable voltage-feedback op amps. load return currents will couple into the gain resistor to cause The OPA2683 offers an excellent balance between voltage a portion of the 2nd-harmonic distortion. At high gains, this and current noise terms to achieve low output noise in a low- imbalance has more gain to the output giving increased power amplifier. The inverting current noise (11.6pA/√Hz) is 2nd-harmonic distortion. lower than most other current-feedback op amps while the Relative to alternative amplifiers with < 2mA supply current, input voltage noise (4.4nV/√Hz) is lower than any unity-gain the OPA2683 holds much lower distortion at higher frequen- stable, comparable slew rate, < 5mA/ch voltage-feedback op cies (> 5MHz) and to higher gains. Generally, until the amp. This low input voltage noise was achieved at the price fundamental signal reaches very high frequency or power of higher noninverting input current noise (5.1pA/√Hz). As levels, the 2nd-harmonic will dominate the distortion with a long as the AC source impedance looking out of the lower 3rd-harmonic component. Focusing then on the 2nd- noninverting node is less than 200Ω, this current noise will harmonic, increasing the load impedance improves distortion not contribute significantly to the total output noise. The op directly. Remember that the total load includes the feedback amp input voltage noise and the two input current noise network—in the noninverting configuration (see Figure 1) this terms combine to give low output noise under a wide variety is the sum of R + R , while in the inverting configuration it of operating conditions. Figure 14 shows the op amp noise F G is just R . Also, providing an additional supply decoupling analysis model with all the noise terms included. In this F capacitor (0.1µF) between the supply pins (for bipolar opera- model, all noise terms are taken to be noise voltage or tion) improves the 2nd-order distortion slightly (3dB to 6dB). current density terms in either nV/√Hz or pA/√Hz. In most op amps, increasing the output voltage swing in- creases harmonic distortion directly. A low-power part like the OPA2683 includes quiescent boost circuits to provide the E NI full-power bandwidth shown in the Typical Characteristics. These act to increase the bias in a very linear fashion only OPA1/22683 EO when high slew rate or output power are required. This also RS I BN acts to actually reduce the distortion slightly at higher output power levels. The Typical Characteristics show the 2nd- E RS harmonic holding constant from 500mVPP to 5VPP outputs √4kTRS RF while the 3rd-harmonics actually decrease with increasing output power. √4kTRF 4kT RG IBI 4kT = 1.6E –20J RG at 290°K FIGURE 14. Op Amp Noise Analysis Model. OPA2683 21 SBOS244H www.ti.com
The total output spot noise voltage can be computed as the While the last term, the inverting bias current error, is square root of the sum of all squared output noise voltage dominant in this low-gain circuit, the input offset voltage will contributors. Equation 4 shows the general form for the become the dominant DC error term as the gain exceeds output noise voltage using the terms presented in Figure 14. 5V/V. Where improved DC precision is required in a high- (4) speed amplifier, consider the OPA656 single and OPA2822 dual voltage-feedback amplifiers. EO = ENI2 +(IBNRS)2 +4kTRSNG2 +(IBIRF)2 +4kTRFNG DISABLE OPERATION Dividing this expression by the noise gain (NG = (1 + R /R )) F G The OPA2683 provides an optional disable feature that may will give the equivalent input referred spot noise voltage at be used to reduce system power when channel operation is the noninverting input, as shown in Equation 5. not required. If the V control pin is left unconnected, the DIS (5) OPA2683 will operate normally. To disable, the control pin must be asserted LOW. Figure 14 shows a simplified internal E = E 2 +(I R )2 +4kTR +IBIRF2 + 4kTRF circuit for the disable control feature. N NI BN S S NG NG +V S Evaluating these two equations for the OPA2683 circuit and component values (see Figure 1) will give a total output spot noise voltage of 15.2nV/√Hz and a total equivalent input spot noise voltage of 7.6nV/√Hz. This total input referred spot 40kΩ noise voltage is higher than the 4.4nV/√Hz specification for the op amp voltage noise alone. This reflects the noise added to the output by the inverting current noise times the Q1 feedback resistor. As the gain is increased, this fixed output noise power term contributes less to the total output noise and the total input referred voltage noise given by Equation 5 will approach just the 4.4nV/√Hz of the op amp itself. For 25kΩ 250kΩ example, going to a gain of +20 in the circuit of Figure 1, adjusting only the gain resistor to 50Ω, will give a total input V IS referred noise of 4.6nV/√Hz. A more complete description of DIS Control –VS op amp noise analysis can be found in TI application note FIGURE 14. Simplified Disable Control Circuit. AB-103, Noise Analysis for High-Speed Op Amps (SBOA066), located at www.ti.com. In normal operation, base current to Q1 is provided through the 250kΩ resistor while the emitter current through the 40kΩ DC ACCURACY AND OFFSET CONTROL resistor sets up a voltage drop that is inadequate to turn on A current-feedback op amp like the OPA2683 provides the two diodes in Q1’s emitter. As V is pulled LOW, DIS exceptional bandwidth in high gains, giving fast pulse settling additional current is pulled through the 40kΩ resistor eventu- but only moderate DC accuracy. The Electrical Characteris- ally turning on these two diodes (≈ 33µA). At this point, any tics show an input offset voltage comparable to high slew further current pulled out of V goes through those diodes DIS rate voltage-feedback amplifiers. The two input bias currents, holding the emitter-base voltage of Q1 at approximately 0V. however, are somewhat higher and are unmatched. Whereas This shuts off the collector current out of Q1, turning the bias current cancellation techniques are very effective with amplifier off. The supply current in the disable mode are only most voltage-feedback op amps, they do not generally re- those required to operate the circuit of Figure 14. duce the output DC offset for wideband current-feedback op When disabled, the output and input nodes go to a high amps. Since the two input bias currents are unrelated in both impedance state. If the OPA2683 is operating in a gain of +1 magnitude and polarity, matching the source impedance (with a 1.2kΩ feedback resistor still required for stability), this looking out of each input to reduce their error contribution to will show a very high impedance (1.7pF || 1MΩ) at the output the output is ineffective. Evaluating the configuration of and exceptional signal isolation. If operating at a gain greater Figure 1, using worst-case +25°C input offset voltage and the than +1, the total feedback network resistance (R + R ) will two input bias currents, gives a worst-case output offset F G appear as the impedance looking back into the output, but range equal to: the circuit will still show very high forward and reverse ±(NG • V ) + (I • R /2 • NG) ± (I • R ) isolation. If configured as an inverting amplifier, the input and OS BN S BI F where NG = noninverting signal gain output will be connected through the feedback network resistance (R + R ) giving relatively poor input to output = ±(2 • 3.5mV) ± (4.5µA • 25Ω • 2) ± (953Ω • 10mA) F G isolation. = ±7.0mV + 0.23mV ± 9.5mV = ±16.73mV OPA2683 22 www.ti.com SBOS244H
The OPA2683 provides very high power gain on low quies- b) Minimize the distance (< 0.25") from the power-sup- cent current levels. When disabled, internal high impedance ply pins to high-frequency 0.1µF decoupling capaci- nodes discharge slowly which, with the exceptional power tors. At the device pins, the ground and power-plane gain provided, give a self powering characteristic that leads layout should not be in close proximity to the signal I/O to a slow turn off characteristic. Typical full turn off times to pins. Avoid narrow power and ground traces to minimize rated 100µA disabled supply current are 60ms. Turn on times inductance between the pins and the decoupling capaci- are very fast—less than 40ns. tors. The power-supply connections should always be decoupled with these capacitors. An optional supply THERMAL ANALYSIS decoupling capacitor (0.01µF) across the two power supplies (for bipolar operation) will improve 2nd-har- The OPA2683 will not require external heatsinking for most monic distortion performance. Larger (2.2µF to 6.8µF) applications. Maximum desired junction temperature will set decoupling capacitors, effective at lower frequency, the maximum allowed internal power dissipation as de- should also be used on the main supply pins. These may scribed below. In no case should the maximum junction be placed somewhat farther from the device and may be temperature be allowed to exceed 150°C. shared among several devices in the same area of the Operating junction temperature (TJ) is given by TA + PD • θJA. PC board. The total internal power dissipation (P ) is the sum of D c) Careful selection and placement of external compo- quiescent power (P ) and additional power dissipated in the DQ nents will preserve the high-frequency performance output stage (P ) to deliver load power. Quiescent power is DL of the OPA2683. Resistors should be a very low reac- simply the specified no-load supply current times the total tance type. Surface-mount resistors work best and allow supply voltage across the part. P will depend on the DL a tighter overall layout. Metal film and carbon composi- required output signal and load but would, for a grounded tion axially-leaded resistors can also provide good high- resistive load, be at a maximum when the output is fixed at frequency performance. Again, keep their leads and a voltage equal to 1/2 of either supply voltage (for equal PCB trace length as short as possible. Never use bipolar supplies). Under this condition P = V 2/(4 • R ) DL S L wirewound type resistors in a high-frequency applica- where R includes feedback network loading. L tion. Since the output pin and inverting input pin are the Note that it is the power in the output stage and not into the most sensitive to parasitic capacitance, always position load that determines internal power dissipation. the feedback and series output resistor, if any, as close As an absolute worst-case example, compute the maximum as possible to the output pin. Other network compo- T using an OPA2683IDCN (SOT23-8 package) in the circuit nents, such as noninverting input termination resistors, J of Figure 1 operating at the maximum specified ambient should also be placed close to the package. The fre- temperature of +85°C with both outputs driving a grounded quency response is primarily determined by the feed- 100Ω load to 2.5V . back resistor value as described previously. Increasing DC its value will reduce the peaking at higher gains, while P = 10V • 2.1mA + 2 • (52 /(4 • (100Ω || 1.9kΩ))) = 153mW D decreasing it will give a more peaked frequency re- Maximum TJ = +85°C + (0.153W • 150°C/W) = 108°C sponse at lower gains. The 800Ω feedback resistor used in the Electrical Characteristics at a gain of +2 on ±5V This maximum operating junction temperature is well below supplies is a good starting point for design. Note that a most system level targets. Most applications will be lower 953Ω feedback resistor, rather than a direct short, is than this since an absolute worst-case output stage power in required for the unity-gain follower application. A cur- both channels simultaneously was assumed in this calculation. rent-feedback op amp requires a feedback resistor even in the unity-gain follower configuration to control stability. BOARD LAYOUT GUIDELINES Achieving optimum performance with a high-frequency am- plifier like the OPA2683 requires careful attention to board layout parasitics and external component types. Recommen- dations that will optimize performance include: a) Minimize parasitic capacitance to any AC ground for all of the signal I/O pins. Parasitic capacitance on the output and inverting input pins can cause instability; on the noninverting input, it can react with the source impedance to cause unintentional bandlimiting. To re- duce unwanted capacitance, a window around the sig- nal I/O pins should be opened in all of the ground and power planes around those pins. Otherwise, ground and power planes should be unbroken elsewhere on the board. OPA2683 23 SBOS244H www.ti.com
d) Connections to other wideband devices on the board e) Socketing a high-speed part like the OPA2683 is not may be made with short direct traces or through on- recommended. The additional lead length and pin-to- board transmission lines. For short connections, con- pin capacitance introduced by the socket can create an sider the trace and the input to the next device as a extremely troublesome parasitic network which can make lumped capacitive load. Relatively wide traces (50mils to it almost impossible to achieve a smooth, stable fre- 100mils) should be used, preferably with ground and quency response. Best results are obtained by soldering power planes opened up around them. Estimate the the OPA2683 onto the board. total capacitive load and set R from the plot of recom- S mended Rs vs CLOAD. Low parasitic capacitive loads INPUT AND ESD PROTECTION (< 5pF) may not need an R since the OPA2683 is S The OPA2683 is built using a very high-speed complemen- nominally compensated to operate with a 2pF parasitic tary bipolar process. The internal junction breakdown volt- load. If a long trace is required, and the 6dB signal loss ages are relatively low for these very small geometry de- intrinsic to a doubly-terminated transmission line is ac- vices. These breakdowns are reflected in the Absolute Maxi- ceptable, implement a matched impedance transmis- mum Ratings table where an absolute maximum 13V across sion line using microstrip or stripline techniques (consult the supply pins is reported. All device pins have limited ESD an ECL design handbook for microstrip and stripline protection using internal diodes to the power supplies, as layout techniques). A 50Ω environment is normally not shown in Figure 15. necessary onboard, and in fact a higher impedance These diodes provide moderate protection to input overdrive environment will improve distortion, as shown in the voltages above the supplies as well. The protection diodes distortion versus load plots. With a characteristic board can typically support 30mA continuous current. Where higher trace impedance defined based on board material and currents are possible (for example, in systems with ±15V trace dimensions, a matching series resistor into the supply parts driving into the OPA2683), current-limiting se- trace from the output of the OPA2683 is used, as well as ries resistors should be added into the two inputs. Keep a terminating shunt resistor at the input of the destina- these resistor values as low as possible since high values tion device. Remember also that the terminating imped- degrade both noise performance and frequency response. ance will be the parallel combination of the shunt resistor and the input impedance of the destination device; this total effective impedance should be set to match the +V trace impedance. The high output voltage and current CC capability of the OPA2683 allows multiple destination devices to be handled as separate transmission lines, External Internal Pin Circuitry each with their own series and shunt terminations. If the 6dB attenuation of a doubly-terminated transmission line is unacceptable, a long trace can be series-terminated –V CC at the source end only. Treat the trace as a capacitive load in this case and set the series resistor value as FIGURE 15. Internal ESD Protection. shown in the plot of Rs vs C . This will not preserve LOAD signal integrity as well as a doubly-terminated line. If the input impedance of the destination device is low, there will be some signal attenuation due to the voltage divider formed by the series output into the terminating imped- ance. OPA2683 24 www.ti.com SBOS244H
Revision History DATE REVISION PAGE SECTION DESCRIPTION 7/09 H 2 Package/Ordering Information Changed package markings for D (SO-8) and DGS (MSOP-10) packages. 7/08 G 2 Absolute Maximum Ratings Changed minimum storage temperature from −40°C to −65°C. NOTE: Page numbers for previous revisions may differ from page numbers in the current version. OPA2683 25 SBOS244H www.ti.com
PACKAGE OPTION ADDENDUM www.ti.com 6-Feb-2020 PACKAGING INFORMATION Orderable Device Status Package Type Package Pins Package Eco Plan Lead/Ball Finish MSL Peak Temp Op Temp (°C) Device Marking Samples (1) Drawing Qty (2) (6) (3) (4/5) OPA2683ID ACTIVE SOIC D 8 75 Green (RoHS NIPDAU Level-2-260C-1 YEAR -40 to 85 OPA & no Sb/Br) 2683 OPA2683IDCNR ACTIVE SOT-23 DCN 8 3000 Green (RoHS NIPDAU Level-2-260C-1 YEAR -40 to 85 B83 & no Sb/Br) OPA2683IDCNRG4 ACTIVE SOT-23 DCN 8 3000 Green (RoHS NIPDAU Level-2-260C-1 YEAR -40 to 85 B83 & no Sb/Br) OPA2683IDCNT ACTIVE SOT-23 DCN 8 250 Green (RoHS NIPDAU Level-2-260C-1 YEAR -40 to 85 B83 & no Sb/Br) OPA2683IDGST ACTIVE VSSOP DGS 10 250 Green (RoHS NIPDAUAG Level-2-260C-1 YEAR -40 to 85 BUI & no Sb/Br) OPA2683IDGSTG4 ACTIVE VSSOP DGS 10 250 Green (RoHS NIPDAUAG Level-2-260C-1 YEAR -40 to 85 BUI & no Sb/Br) (1) The marketing status values are defined as follows: ACTIVE: Product device recommended for new designs. LIFEBUY: TI has announced that the device will be discontinued, and a lifetime-buy period is in effect. NRND: Not recommended for new designs. Device is in production to support existing customers, but TI does not recommend using this part in a new design. PREVIEW: Device has been announced but is not in production. Samples may or may not be available. OBSOLETE: TI has discontinued the production of the device. (2) RoHS: TI defines "RoHS" to mean semiconductor products that are compliant with the current EU RoHS requirements for all 10 RoHS substances, including the requirement that RoHS substance do not exceed 0.1% by weight in homogeneous materials. Where designed to be soldered at high temperatures, "RoHS" products are suitable for use in specified lead-free processes. TI may reference these types of products as "Pb-Free". RoHS Exempt: TI defines "RoHS Exempt" to mean products that contain lead but are compliant with EU RoHS pursuant to a specific EU RoHS exemption. Green: TI defines "Green" to mean the content of Chlorine (Cl) and Bromine (Br) based flame retardants meet JS709B low halogen requirements of <=1000ppm threshold. Antimony trioxide based flame retardants must also meet the <=1000ppm threshold requirement. (3) MSL, Peak Temp. - The Moisture Sensitivity Level rating according to the JEDEC industry standard classifications, and peak solder temperature. (4) There may be additional marking, which relates to the logo, the lot trace code information, or the environmental category on the device. (5) Multiple Device Markings will be inside parentheses. Only one Device Marking contained in parentheses and separated by a "~" will appear on a device. If a line is indented then it is a continuation of the previous line and the two combined represent the entire Device Marking for that device. Addendum-Page 1
PACKAGE OPTION ADDENDUM www.ti.com 6-Feb-2020 (6) Lead/Ball Finish - Orderable Devices may have multiple material finish options. Finish options are separated by a vertical ruled line. Lead/Ball Finish values may wrap to two lines if the finish value exceeds the maximum column width. Important Information and Disclaimer:The information provided on this page represents TI's knowledge and belief as of the date that it is provided. TI bases its knowledge and belief on information provided by third parties, and makes no representation or warranty as to the accuracy of such information. Efforts are underway to better integrate information from third parties. TI has taken and continues to take reasonable steps to provide representative and accurate information but may not have conducted destructive testing or chemical analysis on incoming materials and chemicals. TI and TI suppliers consider certain information to be proprietary, and thus CAS numbers and other limited information may not be available for release. In no event shall TI's liability arising out of such information exceed the total purchase price of the TI part(s) at issue in this document sold by TI to Customer on an annual basis. Addendum-Page 2
PACKAGE MATERIALS INFORMATION www.ti.com 1-May-2019 TAPE AND REEL INFORMATION *Alldimensionsarenominal Device Package Package Pins SPQ Reel Reel A0 B0 K0 P1 W Pin1 Type Drawing Diameter Width (mm) (mm) (mm) (mm) (mm) Quadrant (mm) W1(mm) OPA2683IDGST VSSOP DGS 10 250 180.0 12.4 5.3 3.4 1.4 8.0 12.0 Q1 PackMaterials-Page1
PACKAGE MATERIALS INFORMATION www.ti.com 1-May-2019 *Alldimensionsarenominal Device PackageType PackageDrawing Pins SPQ Length(mm) Width(mm) Height(mm) OPA2683IDGST VSSOP DGS 10 250 210.0 185.0 35.0 PackMaterials-Page2
None
None
PACKAGE OUTLINE DGS0010A VSSOP - 1.1 mm max height SCALE 3.200 SMALL OUTLINE PACKAGE C 5.05 4.75 TYP SEATING PLANE A PIN 1 ID 0.1 C AREA 8X 0.5 10 1 3.1 2X 2.9 NOTE 3 2 5 6 0.27 10X 0.17 B 3.1 0.1 C A B 1.1 MAX 2.9 NOTE 4 0.23 TYP SEE DETAIL A 0.13 0.25 GAGE PLANE 0.15 0.7 0 - 8 0.05 0.4 DETAIL A TYPICAL 4221984/A 05/2015 NOTES: 1. All linear dimensions are in millimeters. Any dimensions in parenthesis are for reference only. Dimensioning and tolerancing per ASME Y14.5M. 2. This drawing is subject to change without notice. 3. This dimension does not include mold flash, protrusions, or gate burrs. Mold flash, protrusions, or gate burrs shall not exceed 0.15 mm per side. 4. This dimension does not include interlead flash. Interlead flash shall not exceed 0.25 mm per side. 5. Reference JEDEC registration MO-187, variation BA. www.ti.com
EXAMPLE BOARD LAYOUT DGS0010A VSSOP - 1.1 mm max height SMALL OUTLINE PACKAGE 10X (1.45) 10X (0.3) SYMM (R0.05) TYP 1 10 SYMM 8X (0.5) 5 6 (4.4) LAND PATTERN EXAMPLE SCALE:10X SOOPLEDNEINRG MASK METAL MSOELTDAEL RU NMDAESRK SOOPLEDNEINRG MASK 0.05 MAX 0.05 MIN ALL AROUND ALL AROUND NON SOLDER MASK SOLDER MASK DEFINED DEFINED SOLDER MASK DETAILS NOT TO SCALE 4221984/A 05/2015 NOTES: (continued) 6. Publication IPC-7351 may have alternate designs. 7. Solder mask tolerances between and around signal pads can vary based on board fabrication site. www.ti.com
EXAMPLE STENCIL DESIGN DGS0010A VSSOP - 1.1 mm max height SMALL OUTLINE PACKAGE 10X (1.45) SYMM (R0.05) TYP 10X (0.3) 1 10 SYMM 8X (0.5) 5 6 (4.4) SOLDER PASTE EXAMPLE BASED ON 0.125 mm THICK STENCIL SCALE:10X 4221984/A 05/2015 NOTES: (continued) 8. Laser cutting apertures with trapezoidal walls and rounded corners may offer better paste release. IPC-7525 may have alternate design recommendations. 9. Board assembly site may have different recommendations for stencil design. www.ti.com
PACKAGE OUTLINE D0008A SOIC - 1.75 mm max height SCALE 2.800 SMALL OUTLINE INTEGRATED CIRCUIT C SEATING PLANE .228-.244 TYP [5.80-6.19] .004 [0.1] C A PIN 1 ID AREA 6X .050 [1.27] 8 1 2X .189-.197 [4.81-5.00] .150 NOTE 3 [3.81] 4X (0 -15 ) 4 5 8X .012-.020 B .150-.157 [0.31-0.51] .069 MAX [3.81-3.98] .010 [0.25] C A B [1.75] NOTE 4 .005-.010 TYP [0.13-0.25] 4X (0 -15 ) SEE DETAIL A .010 [0.25] .004-.010 0 - 8 [0.11-0.25] .016-.050 [0.41-1.27] DETAIL A (.041) TYPICAL [1.04] 4214825/C 02/2019 NOTES: 1. Linear dimensions are in inches [millimeters]. Dimensions in parenthesis are for reference only. Controlling dimensions are in inches. Dimensioning and tolerancing per ASME Y14.5M. 2. This drawing is subject to change without notice. 3. This dimension does not include mold flash, protrusions, or gate burrs. Mold flash, protrusions, or gate burrs shall not exceed .006 [0.15] per side. 4. This dimension does not include interlead flash. 5. Reference JEDEC registration MS-012, variation AA. www.ti.com
EXAMPLE BOARD LAYOUT D0008A SOIC - 1.75 mm max height SMALL OUTLINE INTEGRATED CIRCUIT 8X (.061 ) [1.55] SYMM SEE DETAILS 1 8 8X (.024) [0.6] SYMM (R.002 ) TYP [0.05] 5 4 6X (.050 ) [1.27] (.213) [5.4] LAND PATTERN EXAMPLE EXPOSED METAL SHOWN SCALE:8X SOLDER MASK SOLDER MASK METAL OPENING OPENING METAL UNDER SOLDER MASK EXPOSED METAL EXPOSED METAL .0028 MAX .0028 MIN [0.07] [0.07] ALL AROUND ALL AROUND NON SOLDER MASK SOLDER MASK DEFINED DEFINED SOLDER MASK DETAILS 4214825/C 02/2019 NOTES: (continued) 6. Publication IPC-7351 may have alternate designs. 7. Solder mask tolerances between and around signal pads can vary based on board fabrication site. www.ti.com
EXAMPLE STENCIL DESIGN D0008A SOIC - 1.75 mm max height SMALL OUTLINE INTEGRATED CIRCUIT 8X (.061 ) [1.55] SYMM 1 8 8X (.024) [0.6] SYMM (R.002 ) TYP [0.05] 5 4 6X (.050 ) [1.27] (.213) [5.4] SOLDER PASTE EXAMPLE BASED ON .005 INCH [0.125 MM] THICK STENCIL SCALE:8X 4214825/C 02/2019 NOTES: (continued) 8. Laser cutting apertures with trapezoidal walls and rounded corners may offer better paste release. IPC-7525 may have alternate design recommendations. 9. Board assembly site may have different recommendations for stencil design. www.ti.com
IMPORTANTNOTICEANDDISCLAIMER TI PROVIDES TECHNICAL AND RELIABILITY DATA (INCLUDING DATASHEETS), DESIGN RESOURCES (INCLUDING REFERENCE DESIGNS), APPLICATION OR OTHER DESIGN ADVICE, WEB TOOLS, SAFETY INFORMATION, AND OTHER RESOURCES “AS IS” AND WITH ALL FAULTS, AND DISCLAIMS ALL WARRANTIES, EXPRESS AND IMPLIED, INCLUDING WITHOUT LIMITATION ANY IMPLIED WARRANTIES OF MERCHANTABILITY, FITNESS FOR A PARTICULAR PURPOSE OR NON-INFRINGEMENT OF THIRD PARTY INTELLECTUAL PROPERTY RIGHTS. These resources are intended for skilled developers designing with TI products. You are solely responsible for (1) selecting the appropriate TI products for your application, (2) designing, validating and testing your application, and (3) ensuring your application meets applicable standards, and any other safety, security, or other requirements. These resources are subject to change without notice. TI grants you permission to use these resources only for development of an application that uses the TI products described in the resource. Other reproduction and display of these resources is prohibited. No license is granted to any other TI intellectual property right or to any third party intellectual property right. TI disclaims responsibility for, and you will fully indemnify TI and its representatives against, any claims, damages, costs, losses, and liabilities arising out of your use of these resources. TI’s products are provided subject to TI’s Terms of Sale (www.ti.com/legal/termsofsale.html) or other applicable terms available either on ti.com or provided in conjunction with such TI products. TI’s provision of these resources does not expand or otherwise alter TI’s applicable warranties or warranty disclaimers for TI products. Mailing Address: Texas Instruments, Post Office Box 655303, Dallas, Texas 75265 Copyright © 2020, Texas Instruments Incorporated