ICGOO在线商城 > 光电元件 > LED - 电路板指示器,阵列,发光条,条形图 > HDSP-4830
 Datasheet下载
- 型号: HDSP-4830
- 制造商: Avago Technologies
- 库位|库存: xxxx|xxxx
- 要求:
| 数量阶梯 | 香港交货 | 国内含税 |
| +xxxx | $xxxx | ¥xxxx |
查看当月历史价格
查看今年历史价格
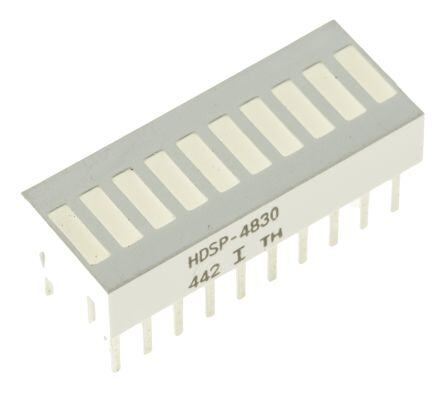
HDSP-4830产品简介:
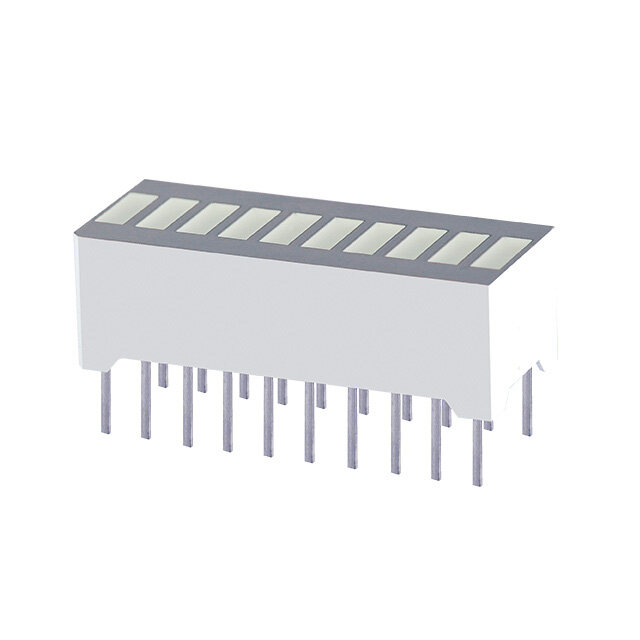
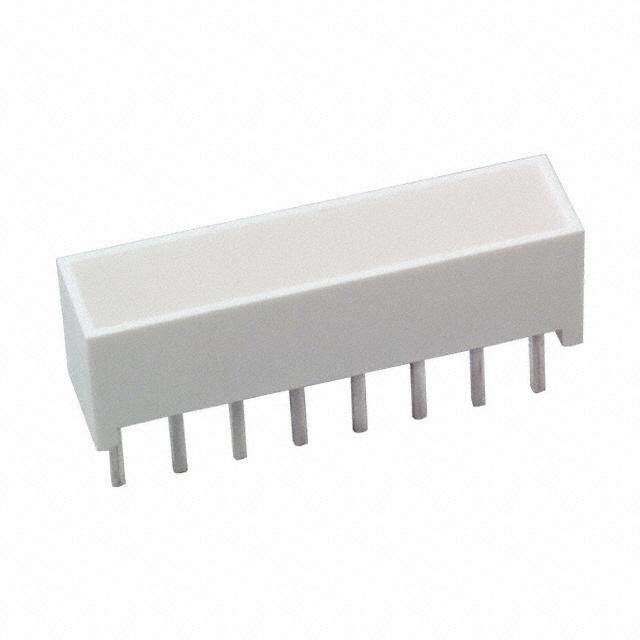
ICGOO电子元器件商城为您提供HDSP-4830由Avago Technologies设计生产,在icgoo商城现货销售,并且可以通过原厂、代理商等渠道进行代购。 HDSP-4830价格参考¥18.21-¥41.87。Avago TechnologiesHDSP-4830封装/规格:LED - 电路板指示器,阵列,发光条,条形图, LED Circuit Board Indicator Bar - 10 Wide, DIP Red (x 10) 2.1V 30mA Rectangle with Flat Top, 5.08mm x 1.52mm Through Hole。您可以下载HDSP-4830参考资料、Datasheet数据手册功能说明书,资料中有HDSP-4830 详细功能的应用电路图电压和使用方法及教程。
型号为HDSP-4830的LED产品由Broadcom Limited(安华高科技)生产,属于LED - 电路板指示器、阵列、发光条、条形图类别。该器件是一款高亮度、多段式LED条形显示器,常用于需要直观显示模拟量或数字量变化的设备中。

其典型应用场景包括:

1. 仪器仪表:如万用表、示波器等电子测量设备中,用于显示电压、电流或其他参数的强度变化。
2. 工业控制设备:在PLC、变频器、传感器等工业自动化装置中,作为状态或过程变量的可视化指示。
3. 音频设备:如音响系统的均衡器、音量指示器,用于实时显示音频信号强度。
4. 医疗设备:用于生命体征监测设备中的趋势显示,例如心率、血氧饱和度的变化指示。
5. 消费电子产品:如智能家电、环境监测设备中作为数据状态的图形化提示。

该LED模块具有良好的可视角度和稳定的亮度表现,适合在多种环境中提供清晰直观的信息反馈。
| 参数 | 数值 |
| 产品目录 | |
| 描述 | LED BAR GRAPH 10SEG HE REDLED条和阵列 Red Light Bar 2.1 V 3.5 mcd |
| 产品分类 | |
| 品牌 | Avago Technologies |
| 产品手册 | http://www.avagotech.com/pages/en/led_displays/light_bars/bar_graph_arrays/single_color_series/hdsp-4830/ |
| 产品图片 |
|
| rohs | 符合RoHS无铅 / 符合限制有害物质指令(RoHS)规范要求 |
| 产品系列 | LED灯泡与模块,LED 指示,LED条和阵列,Avago Technologies HDSP-4830HDSP-4830 |
| 数据手册 | http://www.avagotech.com/docs/AV02-1798EN |
| 产品型号 | HDSP-4830 |
| 产品目录绘图 |
|
| 产品目录页面 | |
| 产品种类 | LED条和阵列 |
| 光强度 | 3500 mcd |
| 其它名称 | 516-1238-5 |
| 包装 | 管件 |
| 商标 | Avago Technologies |
| 安装类型 | 通孔 |
| 封装 | Tube |
| 工作电源电压 | 2.1 V |
| 工厂包装数量 | 120 |
| 标准包装 | 120 |
| 毫烛光等级 | 3.5mcd |
| 波长-峰值 | 635nm |
| 照明颜色 | Red |
| 电流 | 30mA |
| 视角 | - |
| 透镜样式/尺寸 | 矩形,5.08mm x 1.52mm |
| 透镜类型 | - |
| 配置 | 灯条 - 10 灯,宽,DIP |
| 颜色 | 红(x 10) |
| 额定电压 | 2.1V |


- 商务部:美国ITC正式对集成电路等产品启动337调查
- 曝三星4nm工艺存在良率问题 高通将骁龙8 Gen1或转产台积电
- 太阳诱电将投资9.5亿元在常州建新厂生产MLCC 预计2023年完工
- 英特尔发布欧洲新工厂建设计划 深化IDM 2.0 战略
- 台积电先进制程称霸业界 有大客户加持明年业绩稳了
- 达到5530亿美元!SIA预计今年全球半导体销售额将创下新高
- 英特尔拟将自动驾驶子公司Mobileye上市 估值或超500亿美元
- 三星加码芯片和SET,合并消费电子和移动部门,撤换高东真等 CEO
- 三星电子宣布重大人事变动 还合并消费电子和移动部门
- 海关总署:前11个月进口集成电路产品价值2.52万亿元 增长14.8%


PDF Datasheet 数据手册内容提取
HDSP-4830/4840/4850, HDSP-4832/4836 & HLCP-J100 10-Element Bar Graph Array Data Sheet Description Features These 10-element LED arrays are designed to display • Custom Multicolor Array Capability information in easily recognizable bar graph form. The • Matched LEDs for Uniform Appearance packages are end stackable and therefore capable of • End Stackable displaying long strings of information. Use of these bar graph arrays eliminates the alignment, intensity, and • Package Interlock Ensures Correct Alignment color matching problems associated with discrete LEDs. • Low Profile Package The HDSP-4830/4840/4850 and HLCPJ100 each contain • Rugged Construction LEDs of one color. The HDSP-4832/4836 are multicolor arrays with High Efficiency Red, Yellow, and High Perfor- • Large, Easily Recognizable Segments mance Green LEDs in a single package. • High ON-OFF Contrast, Segment to Segment • Wide Viewing Angle Applications • Categorized for Luminous Intensity • Industrial Controls • HDSP-4832/4836/4840/4850 Categorized for Domi- • Instrumentation nant Wavelength • Office Equipment • HLCP-J100 Operates at Low Current • Computer Peripherals Typical Intensity of 1.0 mcd at 1 mA Drive Current • Consumer Products Package Dimensions 25.40 (1.000) MAX. 0.38 (0.015) 1. DIMENSIONS IN MILLIMETERS (INCHES). 2. ALL UNTOLERANCED DIMEMSIONS FOR REFERENCE ONLY. 10.16 3. HDSP-4832/-4836/-4840/-4850 ONLY. 5.08 (0.200) (0.400) MAX. 2.54 1.52 (0.100) (0.060) LUMINOUS COLOR BIN 6.10 ± 0.25 DATE CODE INTENSITY (NOTE 3) (0.240 ± 0.010) CATEGORY PIN ONE MARKING HDSP XXXX 5.08 (0.200) XYY ZW 0.38 (0.015) 4.06 (0.160) 2.54 ± 0.25 MIN. (0.100 ± 0.010) 7.62 ± 0.38 0.61 (0.300 ± 0.015) (0.024)
Absolute Maximum Ratings [1] AlGaAs Red HER Yellow Green Parameter HLCP-J100 HDSP-4830 HDSP-4840 HDSP-4850 Average PowerDissipation per LED 37 mW 87 mW 50 mW 105 mW (TA = 25°C) Peak Forward Current per LED 45 mA[3] 90 mA[4] 60 mA[4] 90 mA[4] DC Forward Current per LED 15 mA[5] 30 mA[6] 20 mA[6] 30 mA[6] Operating Temperature Range -20°C to +100°C -40°C to +85°C -20°C to +85°C Storage Temperature Range -55°C to +100°C -40°C to +85°C Reverse Voltage per LED 5.0 V 3.0 V Lead Solder Dipping Temperature (1.59 mm (1/16 inch) 260°C for 5 seconds [8] below seating plane) [7] Wave Soldering Temperature 250°C for 3 seconds (at 2 mm distance from the body) Notes: 1. Absolute maximum ratings for HER, Yellow, and Green elements of the multicolor arrays are identical to the HDSP-4830/4840/4850 maximum ratings. 2. See Figure 1 to establish pulsed operating conditions. Maximum pulse width is 1.5 ms. 3. See Figure 2 to establish pulsed operating conditions. Maximum pulse width is 1.5 ms. 4. See Figure 8 to establish pulsed operating conditions. Maximum pulse width is 2 ms. 5. Derate maximum DC current for Red above TA = 62°C at 0.79 mA/°C, and AlGaAs Red above TA = 91°C at 0.8 mA/°C. See Figure 3. 6. Derate maximum DC current for HER above TA = 48°C at 0.58 mA/ °C, Yellow above TA = 70°C at 0.66 mA/°C, and Green above TA = 37°C at 0.48 mA/°C. See Figure 9. 7. Clean only in water, isopropanol, ethanol, Freon TF or TE (or equivalent), or Genesolve DI-15 (or equivalent). 8. Maximum tolerable component side temperature is 134°C during solder process. Internal Circuit Diagram Multicolor Array Segment Colors HDSP-4832 HDSP-4836 a 1 20 Segment Segment Color Segment Color 2 b 19 3 c 18 a HER HER 4 d 17 b HER HER 5 e 16 c HER Yellow f 6 15 d Yellow Yellow g 7 14 e Yellow Green 8 h 13 f Yellow Green 9 i 12 j g Yellow Yellow 10 11 h Green Yellow Pin Function Pin Function i Green HER 1 Anode a 11 Cathode j j Green HER 2 Anode b 12 Cathode I 3 Anode c 13 Cathode h 4 Anode d 14 Cathode g 5 Anode e 15 Cathode f 6 Anode f 16 Cathode e 7 Anode g 17 Cathode d 8 Anode h 18 Cathode c 9 Anode i 19 Cathode b 10 Anode j 20 Cathode a 2
Electrical/Optical Characteristics at T = 25°C[4] A AlGaAs Red HLCP-J100 Parameter Symbol Min. Typ. Max. Units Test Conditions Luminous Intensity per LED IV 600 1000 mcd IF = 1 mA (Unit Average) [1] 5200 IF = 20 mA Pk; 1 of 4 Duty Factor Peak Wavelength λPEAK 645 nm Dominant Wavelength[2] λd 637 nm Forward Voltage per LED VF 1.6 V IF = 1 mA 1.8 2.2 IF = 20 mA Reverse Voltage per LED[5] VR 5 1.5 V IR = 100 mA Temperature Coefficient VF per LED DVF/°C -2.0 mV/°C Thermal Resistance LED Junction-to-Pin RqJ-PIN 300 °C/W/LED High Efficiency Red HDSP-4830 Parameter Symbol Min. Typ. Max. Units Test Conditions Luminous Intensity per LED (Unit Average)[1,4] IV 900 3500 mcd IF = 10 mA Peak Wavelength λPEAK 635 nm Dominant Wavelength[2] λd 626 nm Forward Voltage per LED VF 2.1 2.5 V IF = 20 mA Reverse Voltage per LED[5] VR 3 30 V IR = 100 mA Temperature Coefficient VF per LED DVF /°C -2.0 mV/°C Thermal Resistance LED Junction-to-Pin RqJ-PIN 300 °C/W/LED Yellow HDSP-4840 Parameter Symbol Min. Typ. Max. Units Test Conditions Luminous Intensity per LED (Unit Average)[1,4] IV 600 1900 mcd IF = 10 mA Peak Wavelength λPEAK 583 nm Dominant Wavelength[2,3] λd 581 585 592 nm Forward Voltage per LED VF 2.2 2.5 V IF = 20 mA Reverse Voltage per LED[5] VR 3 40 V IR = 100 mA Temperature Coefficient VF per LED DVF/°C -2.0 mV/°C Thermal Resistance LED Junction-to-Pin RqJ-PIN 300 °C/W/LED Green HDSP-4850 Parameter Symbol Min. Typ. Max. Units Test Conditions Luminous Intensity per LED (Unit Average)[1,4] IV 600 1900 mcd IF = 10 mA Peak Wavelength λPEAK 566 nm Dominant Wavelength[2,3] λd 571 577 nm Forward Voltage per LED VF 2.1 2.5 V IF = 20 mA Reverse Voltage per LED[5] VR 3 50 V IR = 100 mA Temperature Coefficient VF per LED DVF/°C -2.0 mV/°C Thermal Resistance LED Junction-to-Pin RqJ-PIN 300 °C/W/LED Notes: 1. The bar graph arrays are categorized for luminous intensity. The category is designated by a letter located on the side of the package. 2. The dominant wavelength, λd, is derived from the CIE chromaticity diagram and is that single wavelength which defines the color of the de- vice. 3. The HDSP-4832/-4836/-4840/-4850 bar graph arrays are categorized by dominant wavelength with the category designated by a number adjacent to the intensity category letter. Only the yellow elements of the HDSP-4832/-4836 are categorized for color. 4. Electrical/optical characteristics of the High-Efficiency Red elements of the HDSP-4832/-4836 are identical to the HDSP-4830 characteristics. Characteristics of Yellow elements of the HDSP-4832/-4836 are identical to the HDSP-4840. Characteristics of Green elements of the HDSP- 4832/-4836 are identical to the HDSP-4850. 5. Reverse voltage per LED should be limited to 3.0 V max. for the HDSP-4830/-4840/-4850/-4832/-4836 and 5.0 V max. for the HLCP-J100. 3
Red, AlGaAs Red 20 10 9 RATIO OF MAXIMUM OPERATING PEAK CURRENT TO TEMPERATURE DERATED MAXIMUM DC CURRENT 1211.50534568 10 KHz 3KHz 1 KHz 300 Hz100 Hzf - REFRESH RATE ORTDEEPEMGRERIAPOATENITRN IRAOGTEN UOQ IFURN EII RD TCEHMSI AS X RATIO OF MAXIMUM OPERATING PEAK CURRENT TO TEMPERATURE DERATED MAXIMUM DC CURRENT 345678 10 KHz3KHz 1 KHz300 Hz100 Hzf - REFRESH RATE ORTDEEPEMGRERIAPOATENITRN IRAOGTEN UOQ IFURN EII RD TCEH MSI SA X IMAXPEAK IMAXDC 1.52 I MAxPEAKI MAXDC 2 1 DC OPERATION 1 DC OPERATION 1 10 100 1000 10000 1 10 100 1000 10000 tP - PULSE DURATION - µSEC tP - PULSE DURATION - µs Figure 1. Maximum Tolerable Peak Current vs. Pulse Duration – Red. Figure 2. Maximum Tolerable Peak Current vs. Pulse Duration – AlGaAs Red. 40 1.2 160 MAX - MAXIMUM DC CURRENT PER SEGMENT - mA 1122330505055 AlRGEaDAs RED Rθ J - A = 600¡C/W - RELATIVE EFFICIENCY (NORMALIZED TO ηPEAK1 AT 20 mA FOR RED: AT 1mA FOR AlGaAs RED) 0000011.......5678901 AlGaAs RED RED I - FORWARD CURRENT PER SEGMENT - mAF 11142086420000000 RED AlGaAs RED I DC 0 0.4 0 25 35 45 55 65 75 85 95 105 0 20 40 60 80 100 120 140 160 0 0.5 1.0 1.5 2.0 2.5 3.0 3.5 4.0 TA - AMBIENT TEMPERATURE - oC IPEAK - PEAK SEGMENT CURRENT - mA VF - FORWARD VOLTAGE - V Figure 3. Maximum Allowable DC Current vs. Figure 4. Relative Efficiency (Luminous Intensity Figure 5. Forward Current vs. Forward Voltage. Ambient Temperature. per Unit Current) vs. Peak Current. TJMAX = 100°C for Red and TJMAX = 110°C for AlGaAs Red. 1.4 20 1.2 10 RELATIVE LUMINOUS INTENSITY(NORMALIZED TO 1.0 AT 20 mA)1000....0864 RELATIVE LUMINOUS INTENSITY(NORMALIZED TO 1 AT 1mA) 251 0.2 0 0.1 0 5 10 15 20 25 0.1 0.2 0.5 15 10 20 IF - FORWARD CURRENT PER SEGMENT - mA IF - FORWARD CURRENT PER SEGMENT Figure 6. Relative Luminous Intensity vs. DC For- Figure 7. Relative Luminous Intensity vs. DC For- ward Current – Red. ward Current – AlGaAs. For a Detailed Explanation on the Use of Data Sheet Information and Recommended Soldering Procedures, See Application Note 1005. 4
HER, Yellow, Green 20 RATIO OF MAXIMUM OPERATING PEAK CURRENT TO TEMPERATURE DERATED MAXIMUM DC CURRENT 1112053468 HGYREELRELEONW f - REFRESH RATE OTRTDIDHEEPECM QRIEMSRUAP ARATIEXREITRNEGIAOSGITON UON IFR NE MAXIPEAK MAXI DC 1.52 10 KHz 3 KHz 1 KHz 300 Hz 100 Hz 1 DC OPERATION 1 10 100 1000 10000 tP - PULSE DURATION - µSEC Figure 8. Maximum Tolerable Peak Current vs. Pulse Duration – HER/Yellow/Green. 40 1.6 I MAX - MAXIMUM DC CURRENT PER SEGMENT - mADC 1122330505055 GYREELELNO/WHGREREEN HRERθ J - A = 600Y°ECL/WLOW - RELATIVE EFFICIENCYηPEAK 111110001.........412309875 GRYEEHELNELR OS SEWER RISEIEESRSIES 0 0.6 15 25 35 45 55 65 75 85 95 0 10 20 30 40 50 60 70 80 90 100 TA - AMBIENT TEMPERATURE - °C IPEAK - PEAK SEGMENT CURRENT - mA Figure 9. Maximum Allowable DC Current vs. Figure 10. Relative Efficiency (Luminous Intensity Ambient Temperature. TJMAX = 100°C. per Unit Current) vs. Peak Current. 90 4.0 GREEN SERIES 80 3.5 mA I - FORWARD CURRENT PER SEGMENT - F 76543210000000 HSEERRIES YELLOW SERIES RELATIVE LUMINOUS INTENSITY 322101......050550 0 0 1.0 2.0 3.0 4.0 5.0 0 53 10 15 20 25 30 5 40 VF - FORWARD VOLTAGE - V IF - FORWARD CURRENT PER SEGMENT - mA Figure 11. Forward Current vs. Forward Voltage. Figure 12. Relative Luminous Intensity vs. DC Forward Current. For a Detailed Explanation on the Use of Data Sheet Information and Recommended Soldering Procedures, See Application Note 1005. 5
Electrical/Optical These versatile bar graph arrays are composed of ten Figures 4 and 10 allow the designer to calculate the lu- light emitting diodes. The light from each LED is opti- minous intensity at different peak and average currents. cally stretched to form individual elements. The AlGaAs The following equation calculates intensity at different Red (HLCP-J100) bar graph array LEDs use double het- peak and average currents: erojunction AlGaAs on a GaAs substrate. HER (HDSP- IVAVG = (IFAVG/IFAVG DATA 4830) and Yellow (HDSP-4840) bar graph array LEDs SHEET)ηpeak)(IVDATA SHEET) use a GaAsP epitaxial layer on a GaP substrate. Green (HDSP-4850) bar graph array LEDs use liquid phase GaP Where: epitaxial layer on a GaP substrate. The multicolor bar IVAVG is the calculated time averaged luminous inten- graph arrays (HDSP-4832/4836) have HER, Yellow, and sity resulting from IFAVG. Green LEDs in one package. These displays are designed for strobed operation. The typical forward voltage values IFAVG is the desired time averaged LED current. can be scaled from Figures 5 and 11. These values should IFAVG DATA SHEET is the data sheet test current for be used to calculate the current limiting resistor value IVDATA SHEET. and typical power consumption. Expected maximum VF values for driver circuit design and maximum power dis- ηpeak is the relative efficiency at the peak current, sipation may be calculated using the VFMAX models: scaled from Figure 4 or 10. AlGaAs Red HLCP-J100 series IV DATA SHEET is the data sheet luminous intensity, VFMAX = 1.8 V + IPeak (20 Ω) resulting from IFAVG DATA SHEET. For: IPeak ≤ 20 mA For example, what is the luminous intensity of an HDSP- VFMAX = 2.0 V + IPeak (10 Ω) 4830 driven at 50 mA peak 1/5 duty factor? For: IPeak ≥ 20 mA IFAVG = (50 mA) (0.2) = 10 mA HER (HDSP-4830) and Yellow (HDSP-4840) series IFAVG DATA SHEET = 10 mA VFMAX = 1.6 + IPeak (45 Ω) ηpeak = 1.3 For: 5 mA ≤ IPeak ≤ 20 mA VFMAX = 1.75 + IPeak (38 Ω) IV DATA SHEET = 3500 mcd For: IPeak ≥ 20 mA Therefore Green (HDSP-4850) series IVAVG = (10 mA/10 mA) (1.3) (3500 mcd) = 4550 mcd VFMAX = 2.0 + IPeak (50 Ω) For: IPeak > 5 mA For product information and a complete list of distributors, please go to our web site: www.avagotech.com Avago, Avago Technologies, and the A logo are trademarks of Avago Technologies in the United States and other countries. Data subject to change. Copyright © 2005-2015 Avago Technologies. All rights reserved. Obsoletes AV01-0277EN AV02-1798EN - April 16, 2015